

At 2:14 p.m., a Cincinnati operations manager sees the fulfillment queue climbing. A live dashboard shows which orders are at risk, where drivers are positioned, and which customer commitments are still recoverable. She reroutes two drivers and protects a 3 p.m. delivery.
An hour later, the same decision may be impossible. The dashboard might still look clean because the data reflects an earlier state, while the queue, staffing problem, or missed handoff has already become a customer complaint.
That's the practical promise of real time data visualization. It isn't a faster-looking chart. It's a way to shorten the distance between an event and a decision. For a growing Cincinnati business, the right live dashboard can expose problems before customers do, surface opportunities while they're actionable, and give front-line employees confidence that the numbers reflect what's happening now.
The wrong dashboard becomes expensive theater. The sections below apply an honesty filter: when live reporting earns its cost, when a scheduled refresh is enough, and what your team should skip.
The Moment a Live Dashboard Changes a Decision
A business owner usually doesn't start by asking for a streaming architecture. They start with frustration. The sales dashboard feels hours old, the marketing report arrives after the campaign window has closed, or the operations team keeps arguing about which spreadsheet is current.
That frustration points to a business question, not a software question: Which decisions lose value when the information arrives late?
For a Cincinnati company with roughly 25 to 200 employees, the answer often appears in three situations.
Problems become visible before customers notice
A logistics firm can watch fulfillment queues, route conditions, and delivery status while there's still time to intervene. A healthcare office can monitor appointment flow and staffing pressure instead of discovering a backlog at closing time. A manufacturer can see a production interruption developing rather than waiting for a daily report.
The dashboard doesn't solve the problem by itself. A manager must have authority to reroute work, change staffing, contact a customer, or pause a process. That's why the operating model matters as much as the visualization.
Opportunities remain actionable
A marketing team might spot a surge in qualified inquiries while paid campaigns are still running. A sales manager might see new activity across accounts and reassign attention before the buying window narrows. A retailer might notice inventory moving faster than expected and adjust promotion or purchasing decisions.
Historical reporting still matters for planning. Live reporting matters when the value of an action decays quickly.
Practical rule: If nobody can name the person who acts on a change, the metric probably doesn't belong on a live dashboard.
The historical development of visualization supports this distinction. IBM describes how visualization evolved from much older predecessors into a distinct business intelligence capability, with animated elements emerging to show change through time and modern dashboards shifting toward continuously updated signals and time-sensitive decisions. IBM's review of data visualization history provides useful context for why today's dashboards focus on movement rather than only static summaries.
HDM approaches this kind of work as a business and digital operations problem. A dashboard should fit the decisions your staff already owns, not force your team to invent a process around a new screen.
What Real Time Data Visualization Actually Means
Real time data visualization presents events as they occur, or close enough to occurring that the information can change the next decision. The important measure is not whether a screen refreshes frequently. It's whether the data is fresh enough for the job.
A scheduled dashboard might update overnight, hourly, or at another fixed interval. That can be perfectly appropriate for accounting, monthly SEO reporting, or a sales review. A dashboard that refreshes every few seconds may still fail to be live if the source system only makes new data available later.
One analytics guide says internal data availability may occur approximately every 30 seconds and recommends a dashboard refresh interval of 30 seconds or greater. Another live-dashboard reference describes live metrics as commonly updating within 5 to 10 seconds, while noting that network speed and data volume can affect timing. Sensedia's refresh guidance helps illustrate why the source platform sets a practical limit.
Use three practical tiers
Near-real-time, roughly 1 to 30 seconds, suits most SMB operational dashboards. A logistics company may watch estimated arrival changes, a MedSpa may monitor appointment flow, and a coffee roaster may track production status without needing industrial control speeds.
Soft real-time, under 1 second, fits situations where a delay can alter an immediate response. Think of a dense equipment monitor, an interactive operational map, or a system that needs to flag a rapidly changing condition. It requires more deliberate engineering than a timed refresh.
Hard real-time, guaranteed milliseconds, rarely belongs in an ordinary business dashboard. Industrial controls and safety-critical systems may need guaranteed timing. A Cincinnati service company, professional firm, or marketing department usually doesn't.
A published benchmarking framework defines real-time interactive visualization around under 100 milliseconds or at least 10 frames per second, because that level helps preserve the perception of continuous change. The same research emphasizes measuring each query separately so teams can distinguish ingestion delay, query time, and rendering overhead. The database benchmarking reference is especially useful when a vendor promises "instant" analytics.
Before hiring a developer, ask three questions:
- How fresh is the source data?
- How quickly must someone act?
- What happens if the feed is delayed or wrong?
For broader design guidance, review data visualization best practices. The right answer for most SMBs is near-real-time, not the fastest architecture available.
How the Data Gets There So Fast
Think of a live data system as a relay race. The data is the baton, and every handoff can slow the race, drop information, or expose it to the wrong person.
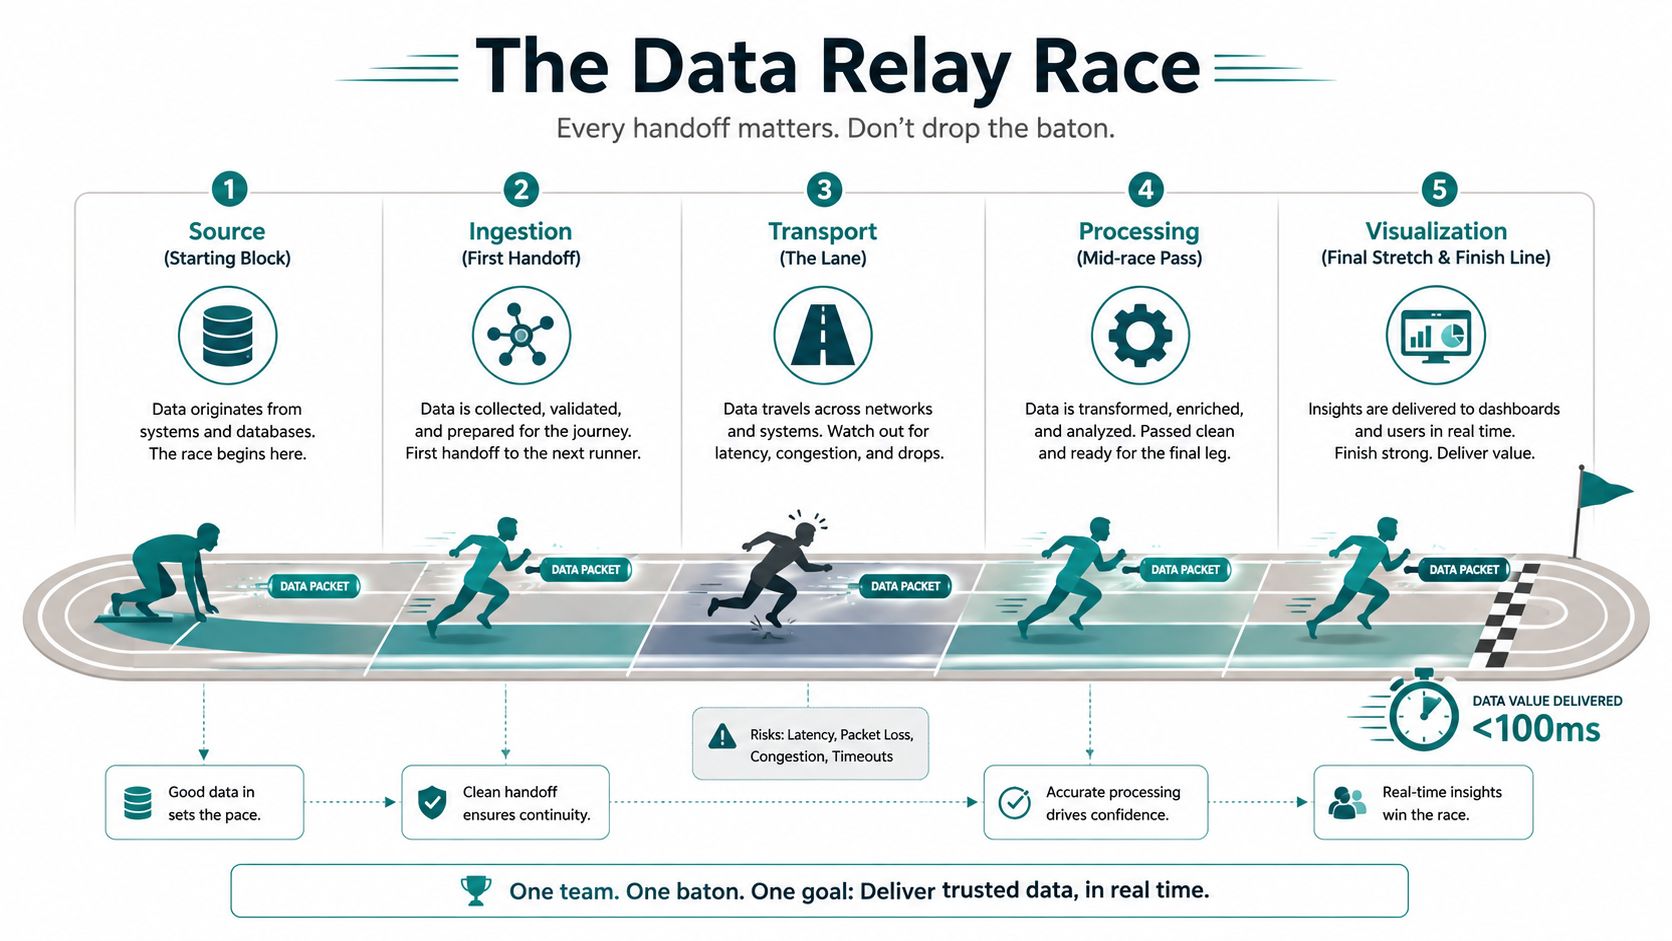
The journey usually looks like this:
Source → ingestion → transport → processing → storage → browser.
The source might be a point-of-sale system, CRM, warehouse, application, sensor, or marketing platform. Ingestion receives the event. Transport moves it between services. Processing cleans or aggregates it. Storage holds a queryable current state. The browser receives the result and renders the view.
Pick transport based on the job
Polling asks the server for new data on a schedule. It's easy to understand, debug, and deploy. For a dashboard that checks every several seconds, polling may be the most responsible choice because it avoids unnecessary infrastructure.
WebSocket creates a two-way connection between browser and server. It fits interactive dashboards where users send filters or commands while the server continuously delivers updates. The trade-off is engineering complexity, connection management, and more involved failure handling.
Server-Sent Events, or SSE, stream updates in one direction from server to browser. They're lightweight and well suited to ticker-style views, status boards, and dashboards where the user only needs to receive changes. A published reference architecture uses Postgres for pre-aggregated time-series data, Redis for pub/sub fan-out, and SSE to push changed metric rows rather than redraw the entire dashboard. The reference architecture for real-time visualization shows why differential updates reduce browser and network work.
Kafka and MQTT are event-broker technologies for high-volume or distributed systems. Kafka emphasizes durable event streams and replayable history. MQTT is common for lightweight device and IoT messaging. Don't adopt either because the names sound enterprise-ready. Use them when event volume, durability, device connectivity, or multiple downstream consumers justify the operational burden.
A Cincinnati SMB should also decide when to stop self-hosting. Managed platforms such as Confluent Cloud, AWS Kinesis, and Azure Event Hubs can reduce the need for a team to maintain streaming infrastructure around the clock. That convenience costs money and creates vendor dependency, but it may still be cheaper than assigning internal staff to continuous monitoring, upgrades, and incident response.
Data also increasingly feeds software agents and automated workflows. For a useful explanation of why AI coworkers need real time data, focus on the same principle that applies to human operators: an automated recommendation is only as current as the events behind it.
Choosing the Right Front End for Live Charts
The front end is a business decision disguised as a developer preference. A dashboard tracking 50 trucks has different rendering needs from a map plotting 50,000 delivery pings per minute. Ask how many points appear at once, how often they change, how many people connect concurrently, and whether customers or employees will use the screen.
Match the renderer to the workload
SVG draws individual shapes in the browser. It's accessible, easy to style, and excellent for modest chart complexity. It becomes inefficient when the browser must manage a very large number of independent elements.
Canvas draws pixels rather than maintaining a separate document object for every mark. It's a sensible upgrade for dense charts, frequent updates, and internal dashboards where accessibility can be handled through surrounding labels and controls.
WebGL uses the browser's graphics hardware for highly dense visualizations, especially maps, point clouds, and animated geospatial views. WebGPU is a newer graphics path with greater low-level capability, but it demands specialized skills and isn't a default choice for a typical SMB reporting screen.
The library should follow the same logic:
| Rendering / Library | Best Fit | Typical Max Point Load | Skill Level Needed | License / Cost |
|---|---|---|---|---|
| SVG | Branded charts with modest density | Depends on chart complexity | Basic to intermediate | Often open source |
| Canvas | Dense internal dashboards | Higher than SVG for frequent updates | Intermediate | Often open source |
| WebGL | Large geospatial or animated datasets | Very high, hardware dependent | Advanced | Varies |
| WebGPU | Specialized high-density browser graphics | Very high, hardware and browser dependent | Advanced | Varies |
| D3 / Observable Plot | Custom editorial graphics and branded storytelling | Best for controlled visual complexity | Intermediate to advanced | Often open source |
| Chart.js / ECharts | Fast SMB dashboards | Moderate to high, depending on configuration | Basic to intermediate | Often open source |
| Vega-Lite | Analyst-maintained declarative charts | Moderate | Intermediate | Often open source |
| deck.gl / MapboxGL | Geospatial density and maps | High, use-case dependent | Intermediate to advanced | Varies |
| Highcharts | Polished commercial reporting | Moderate to high | Intermediate | Commercial licensing may apply |
D3 and Observable Plot make sense for a distinctive infographic embedded in a website or report. Chart.js and ECharts are practical choices for many internal dashboards. Vega-Lite gives analysts a structured way to maintain chart definitions. deck.gl and MapboxGL serve location-heavy products. Highcharts fits organizations that want polished reporting and are comfortable reviewing licensing terms.
Use SVG until chart density or update frequency creates a visible problem. Move to Canvas when the browser struggles with many marks or repeated redraws. Consider WebGL only when the data density and interaction justify specialized engineering.
For application architecture considerations, HDM's guidance on building scalable React applications offers relevant context. For a deeper look at enterprise data platform results, Faberwork LLC's material can help teams evaluate how the data platform affects the experience beyond the chart library.
Latency, Throughput, and Avoiding Alert Fatigue
Latency is the time between an event and the moment a person can use it. Throughput is the amount of event traffic the system can process. Business owners don't need to memorize either term, but they do need to connect both to decisions.
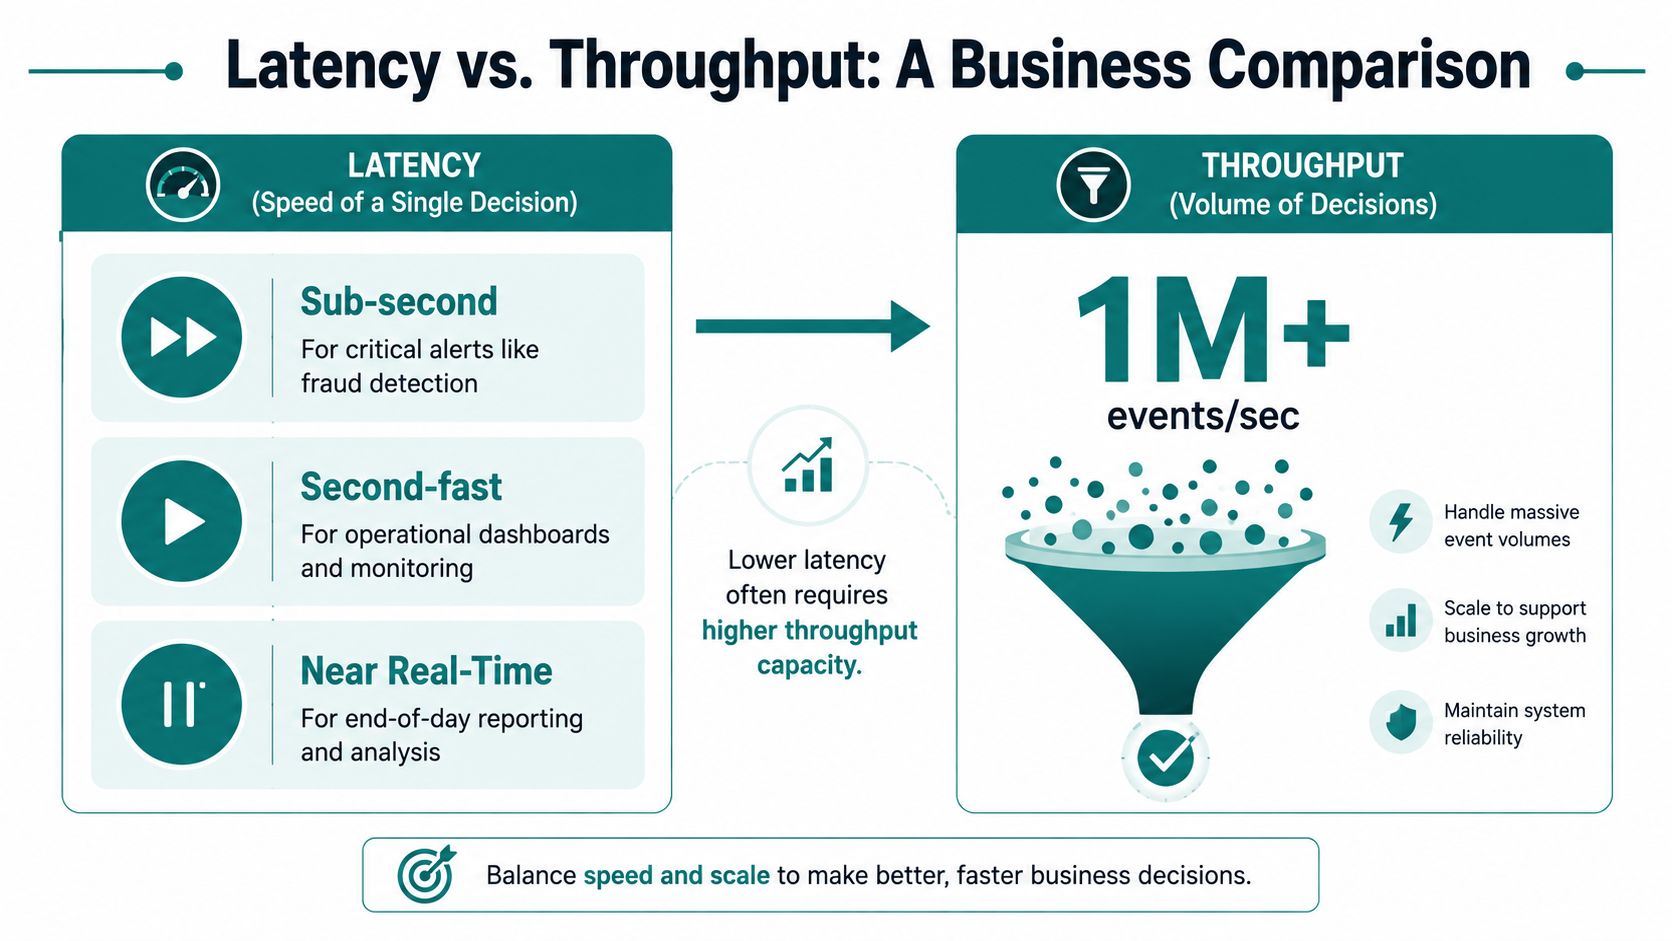
A coffee roaster may need bin levels refreshed every several seconds. A clinic may need appointment flow updated minute by minute. A sales floor may only need new lead activity every few minutes. Making the system faster than those decisions adds cost without adding useful action.
A benchmarking reference places interactive visualization around under 100 milliseconds or at least 10 frames per second for a continuous-update experience, but that target shouldn't become a vanity metric. A system that hits a fast technical target while showing noisy, poorly defined information can still produce worse decisions. The performance research emphasizes separating ingestion, query, and rendering costs so teams can find the actual bottleneck.
Use a decision-based speed test
| Decision timing | Appropriate approach |
|---|---|
| Action happens within seconds | Use a streaming path and carefully designed alerts |
| Action happens within minutes | Near-real-time refresh is usually enough |
| Action doesn't happen within five minutes | Use scheduled reporting or a slower refresh |
Faster updates can increase server load, query pressure, and browser redraw work. They can also make the interface jump around, which reduces trust. The larger danger is alert fatigue. If staff receive warnings for every small fluctuation, they'll eventually ignore the warning that matters.
Design the experience around signals, not raw motion:
- Thresholds should identify conditions that require action.
- Rolling averages should reduce noise without hiding meaningful movement.
- Sparklines should show direction in a compact space.
- Color states should have defined meanings and should never be the only indication of risk.
- Freshness labels should tell users when the latest event arrived.
A real-time dashboard needs an owner for alert rules. Review those rules when the business changes, and remove alerts that no longer trigger a useful response.
Security, Compliance, and Integration Considerations
Live reporting raises the consequences of poor data handling because it makes information easier to access and faster to distribute. Aggregate sales totals present one kind of risk. Patient identifiers, payment information, and personally identifiable information present another.
HIPAA governs protected health information and requires healthcare organizations to control access, protect data, and document handling. PCI concerns payment card data and the systems around it. GDPR creates privacy obligations for covered personal data and the people associated with it. The correct controls depend on the data, users, vendors, and jurisdictions involved, so don't treat a generic dashboard template as a compliance strategy.
A Cincinnati healthcare organization may need a vendor willing to sign a business associate agreement, field-level encryption, role-based access, and audit logging. A professional services firm may need strong authentication and access controls but can often remove much of the risk by showing aggregated performance instead of customer-level records.
| Data Sensitivity | Examples | Required Controls | Integration Pattern | Build vs Buy |
|---|---|---|---|---|
| Low | Aggregated sales or campaign totals | Authentication, access controls, secure connections | BI tool or lightweight API | Buy or configure |
| Moderate | Account activity, operational records | Role-based access, logging, encryption, data minimization | Warehouse plus BI or custom front end | Conditional custom work |
| High | Patient identifiers, payment data, sensitive PII | Contractual controls, audit trails, field-level protection, strict permissions | Governed event pipeline and approved analytics layer | Custom or specialized platform |
Keep the integration pattern proportional
A common architecture sends Kafka, Kinesis, or Pub/Sub events into a warehouse or real-time store, then exposes approved metrics through a BI tool, API, headless CMS, or application interface. A headless CMS such as Contentful or Sanity makes sense when a marketing team needs to combine editorial content with live product or service data. It adds unnecessary complexity when the dashboard is purely internal and a BI platform already handles authentication, filtering, and reporting.
The safest pattern is to reduce scope at the source. Aggregate where possible, anonymize early, and keep sensitive fields out of the visualization pipeline entirely. Most compliance work becomes harder because teams move too much data, not because a bar chart is risky.
For integration planning, HDM's web app integrations service page is a useful reference for the kinds of systems that may need to connect. The important question is what information the dashboard needs, not how much data the organization can technically expose.
Recommended Stacks for SMBs and Enterprise Clients
A growing business shouldn't build an enterprise platform to monitor a handful of operational metrics. It also shouldn't force a customer-facing product into a spreadsheet workflow once live usage becomes part of the product promise.
A practical SMB path
A manageable SMB stack can use a managed event service such as Aiven, Confluent Cloud, or Amazon Kinesis. Materialize or ClickHouse can provide a query layer for current aggregates. A thin Node or Python API can push updates through WebSocket or SSE into React or Vue, or into an embedded dashboard using Apache ECharts, Recharts, or Observable Plot.
This path ships faster and keeps the internal platform burden smaller. The trade-offs are real: the architecture may have a lower ceiling than a customized enterprise system, audit controls may require additional configuration, and the company depends on managed providers. Those limitations are acceptable when the business needs a focused operational view rather than a general-purpose data platform.
An enterprise path
An enterprise implementation may use Kafka on Kubernetes, Apache Flink or Spark Structured Streaming, and a governed semantic layer connected to Looker, Tableau, or Superset. That structure supports more teams, more sources, stricter permissions, and more complex transformations. It also demands platform engineers, documented ownership, operational monitoring, and a budget for long-term maintenance.
Headless CMS tools, Segment, RudderStack, and warehouse synchronization can connect to either path. The difference is governance and scale, not whether the tools can exchange data.
| Layer | SMB Stack | Enterprise Stack |
|---|---|---|
| Event source | SaaS tools, application events, operational databases | Distributed applications, devices, enterprise systems |
| Ingestion | Managed connectors or lightweight APIs | Governed ingestion with Kafka and platform controls |
| Transport | Aiven, Confluent Cloud, or Amazon Kinesis | Kafka on Kubernetes or managed enterprise streaming |
| Processing | Materialize or ClickHouse | Apache Flink or Spark Structured Streaming |
| API delivery | Node or Python with WebSocket or SSE | Dedicated API, gateway, authorization, and service layers |
| Front end | React, Vue, ECharts, Recharts, or embedded BI | Governed BI, product analytics, and custom applications |
| Content and marketing | Headless CMS or warehouse sync | Headless CMS, CDP, warehouse, and permissioned activation |
| Ownership | Agency partner or small internal team | Platform engineering and data governance teams |
HDM can fit the SMB path when a company needs a custom web application, dashboard, integration, or analytics experience rather than a standalone reporting license. HDM's work spans custom web apps, SaaS platforms, client portals, dashboards, and integrations, so the right engagement may be architecture planning, implementation, or confirming that an off-the-shelf tool is enough. Don't pay for custom development until the business case survives the checklist below.
Your Real Time Dashboard Decision Checklist
Run this checklist with your operations lead, technical partner, or agency before anyone writes code. The answers should produce a clear result: go, conditional go, or skip.
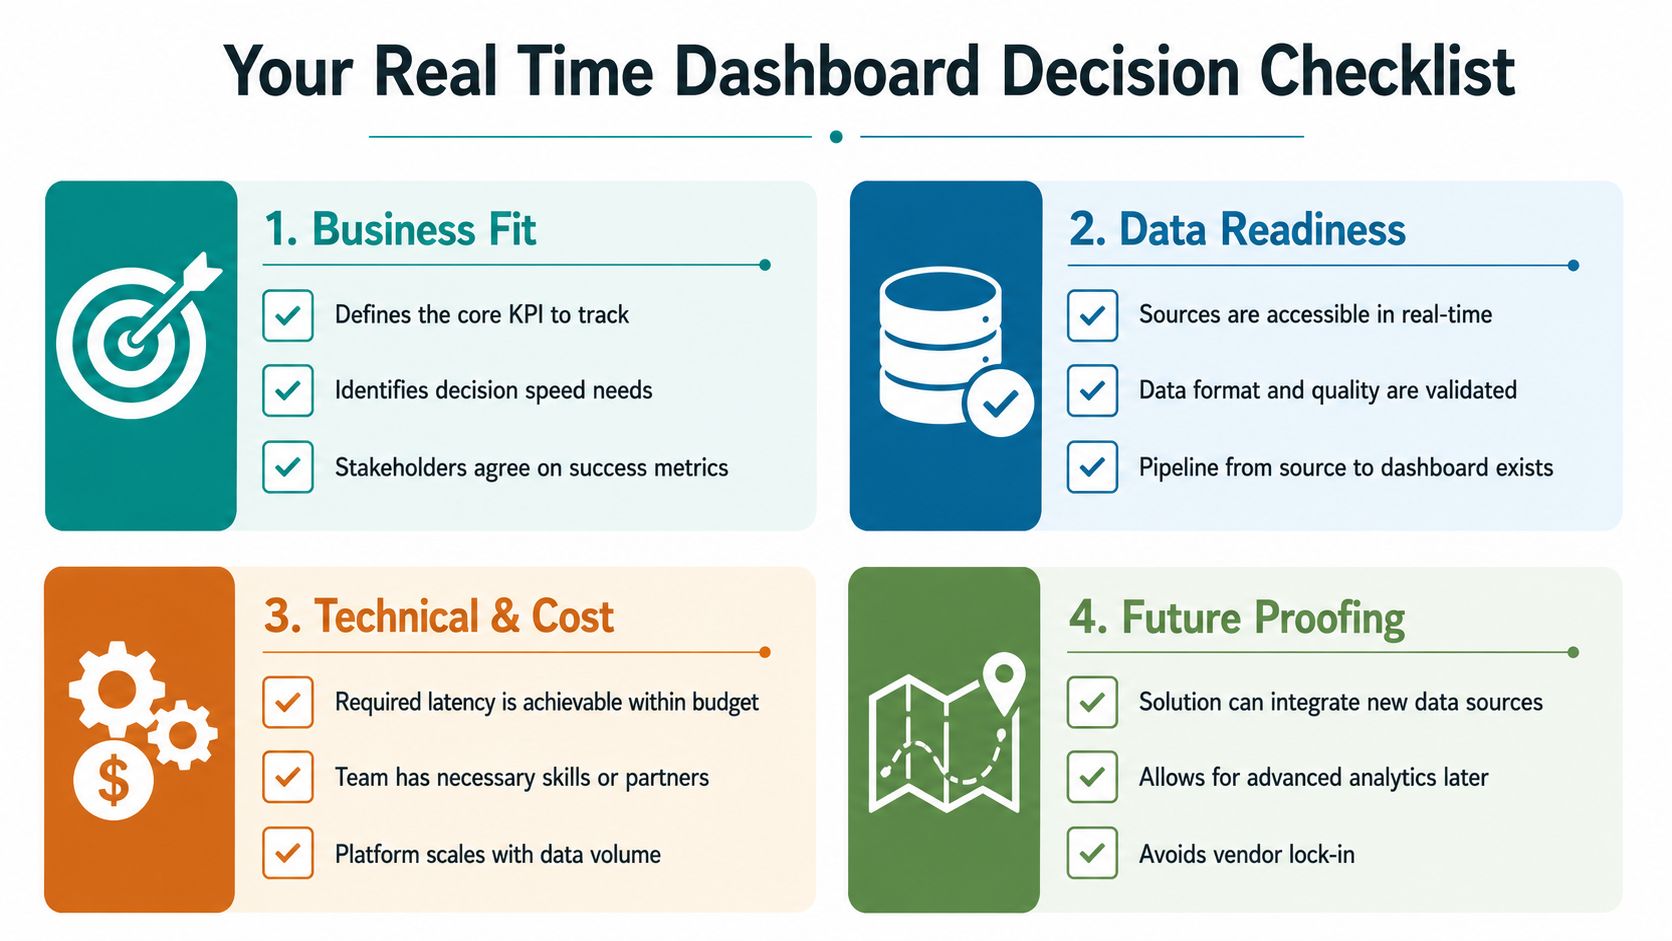
Business fit
- Which decision changes quickly enough to need fresher information?
- Who acts when the metric crosses a threshold?
- What outcome will improve if the team sees the change sooner?
Recommendation: Go when a named person can act during the workday. Choose conditional go when the decision is important but the timing is unclear. Skip live development when the dashboard only summarizes completed periods.
Data readiness
- Which system creates the source event?
- How fresh is that system's data?
- Are the fields accurate, consistent, and available without exposing unnecessary personal information?
Recommendation: Go when the source can deliver usable events. Choose conditional go when a connector or cleanup process is required. Skip until the source system is reliable enough to support decisions.
Technical and cost fit
- Does the current website or application support the required authenticated experience?
- Will employees need mobile access, customer access, or both?
- Can the team support the required refresh or streaming path without overloading the source system?
Recommendation: Go with an off-the-shelf analytics tool when standard charts and permissions are sufficient. Choose custom work when the dashboard must live inside a product, combine unusual systems, or support a workflow that generic software can't model.
Operational readiness
- Who responds when the feed stops or the numbers look wrong?
- Which alerts deserve attention, and who reviews those rules?
- Who owns schema changes, documentation, access permissions, and ongoing maintenance?
Recommendation: Go only when someone owns the system after launch. Choose conditional go when an agency or managed provider will cover the gaps. Skip a live dashboard if nobody can investigate failures, validate unusual changes, or retire alerts that create noise.
For most Cincinnati SMBs, the strongest first move is a narrow pilot around one decision, one accountable team, and a limited set of metrics. HDM can help map the data sources, compare build-versus-buy options, design the interface, and connect the dashboard to the website or internal workflow. Visit HDM to discuss a focused real-time dashboard assessment, custom integration, or a simpler analytics setup that gives your team the information it can use.