

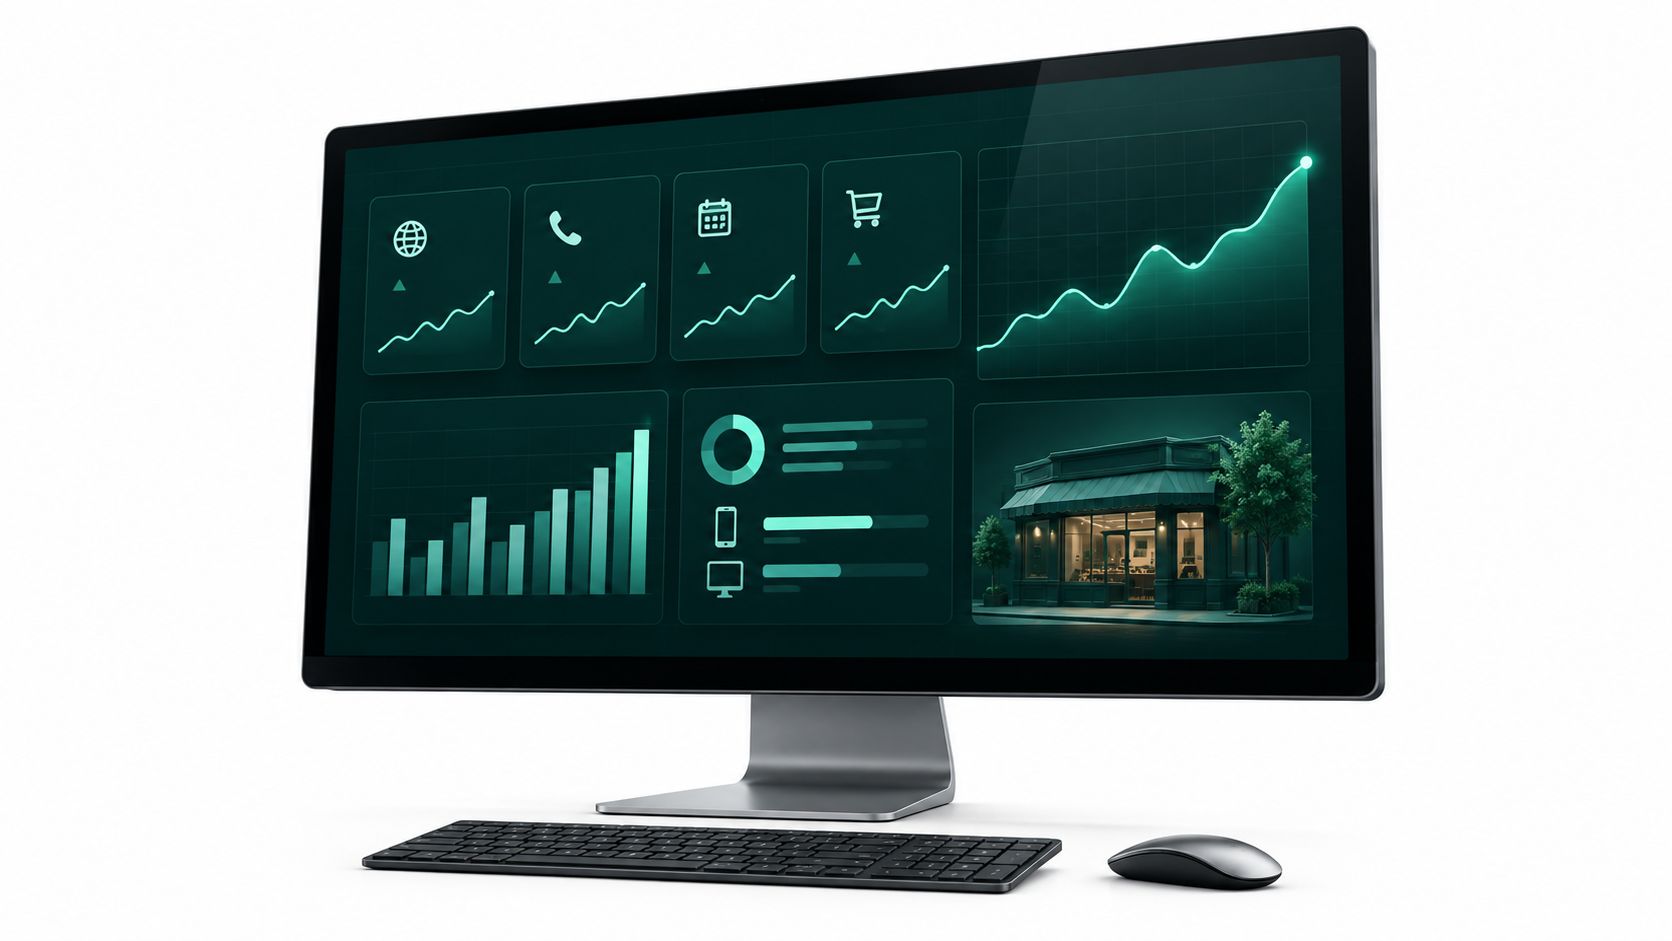
A Greater Cincinnati business owner can see website visits, ad spend, and a full inbox, yet still have no clear answer to a simple question: which channel brought in a qualified inquiry last month? The website report says traffic is up. The ad platform shows clicks. The phone is quiet, and nobody can connect those facts.
That's the gap a useful data analytics dashboard should close. For a service firm, clinic, law practice, shop, or multi-location business evaluating web design, SEO, or digital marketing, the point isn't to collect more charts. It's to make it easier to see what's producing calls, form fills, bookings, and sales, including how results differ between mobile and desktop visitors.
A practical dashboard gives you a shorter path from a business question to a decision. It should help you see what belongs on screen, which measures deserve a weekly check versus a longer review, how to keep the numbers dependable after launch, and what to ask when choosing a tool or partner.
Why Your Business Needs a Data Analytics Dashboard
A dashboard earns its place when it connects marketing activity to business outcomes. Website visits can tell you that people arrived. They can't, on their own, tell you whether those people were a good fit, contacted your team, or bought something.
That distinction matters in Greater Cincinnati, where a local business might run search ads, publish service pages, maintain a social presence, and serve customers at more than one location. If those activities are reported separately, an owner has to piece together the story from multiple screens and spreadsheets. A shared view makes it easier to ask a more useful question: which activity produced the inquiries we want?
Start with the decision, not the chart
A service business may need to know whether calls come from its SEO work or paid campaigns. A clinic may want to see whether appointment requests are coming through on mobile. A retailer may need to distinguish campaign clicks from completed orders. Those are different business questions, so the dashboard should make it possible to filter results by channel, device, service, or location where the information is available.
Separate mobile and desktop views matter because a website can work well on a computer and still frustrate someone trying to contact you by phone. If mobile users visit a key page but don't call or submit a form, that's a problem worth investigating, not another line in a traffic report.
Practical rule: If a dashboard number can't change a decision, it probably doesn't belong on the owner's main screen.
A dashboard won't fix an unclear offer, a slow follow-up process, or a poorly targeted campaign. It can make those issues easier to spot by bringing relevant signals together and showing how they relate to inquiries and sales.
For owners comparing digital marketing partners, ask to see how a report connects activity to outcomes. The useful test isn't whether the screen looks polished. It's whether you can answer a real question about your business without opening a stack of disconnected reports.
What a Data Analytics Dashboard Actually Shows
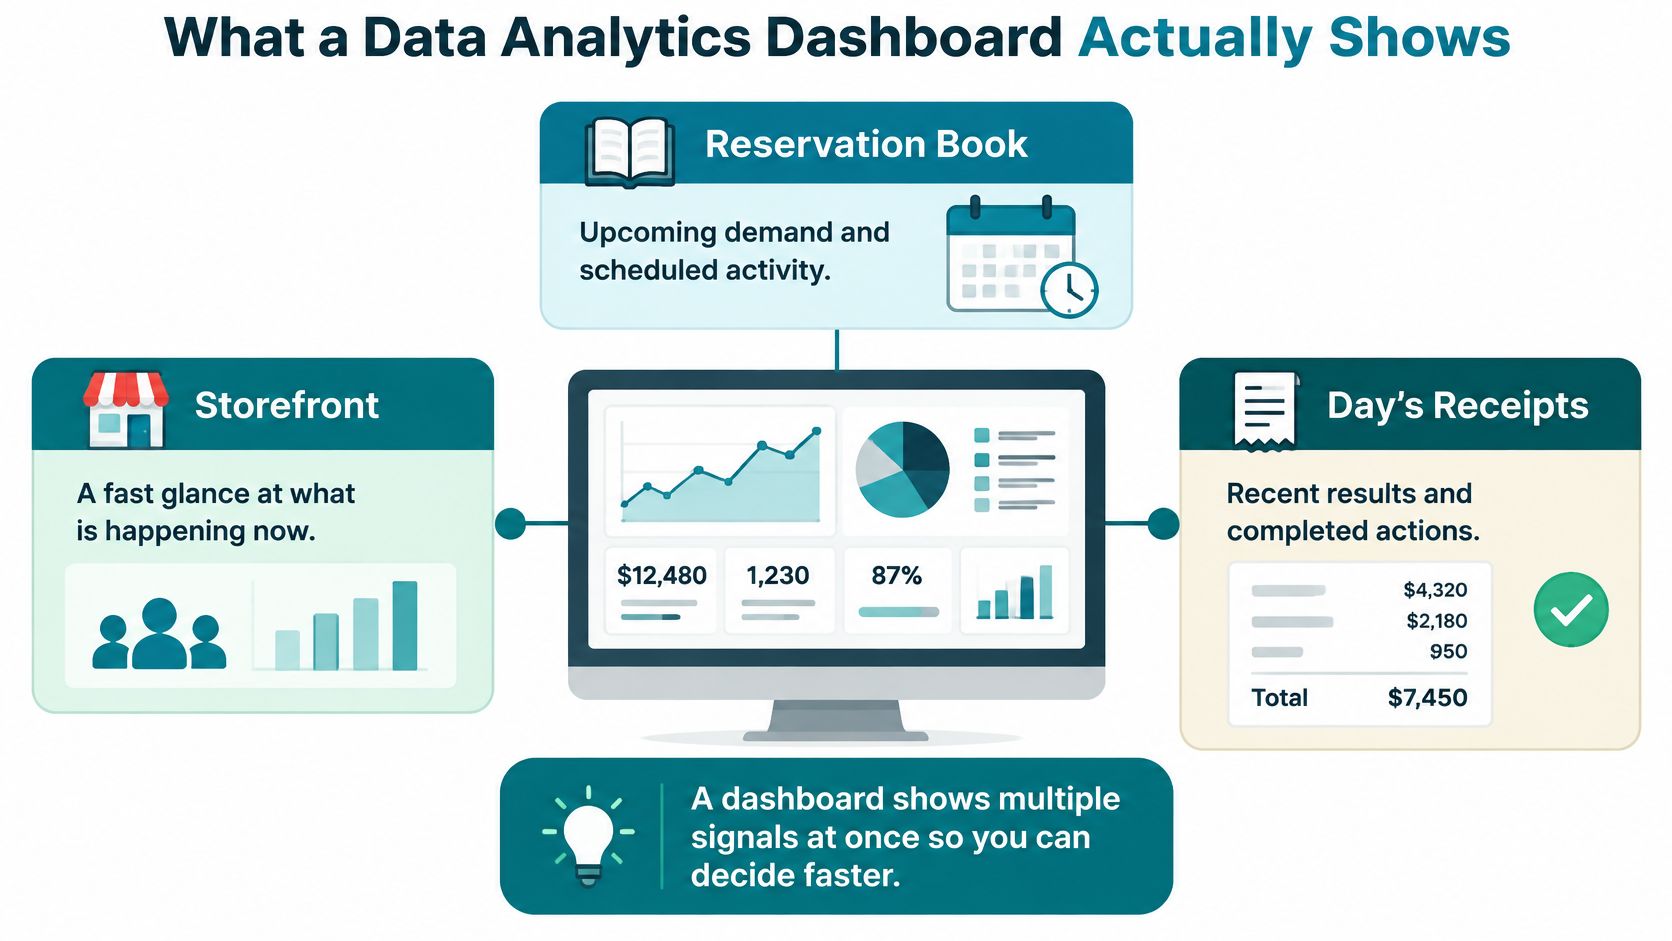
Think of a dashboard as a quick view of your storefront, reservation book, and day's receipts. You can check what's happening now, see what demand is scheduled, and review recent results in one place. Unlike a printed report, you can filter the view to focus on a specific page, campaign, location, or date range.
From glance to investigation
The main screen should make the important signals easy to notice. A trend line can show whether inquiries are rising or falling. A comparison can put one channel beside another. A filter lets you narrow the view, and a link to the supporting records helps you investigate an unusual result.
Charts have been used to make patterns easier to see for centuries. Modern dashboards extend that practical idea with a persistent screen and interaction. The advantage isn't that a dashboard invents a new way to display numbers. It's that an owner can move from a summary to a closer look without waiting for someone to rebuild a monthly PDF.
That drill-down matters. If one location appears to have fewer calls, you'll want to check the date range, campaign, and records behind the total before deciding what to change. A number without a route to its context can be easy to misread.
What it isn't
A dashboard isn't the database where all company information lives, a design mockup, or a collection of impressive-looking but irrelevant metrics. Its job is to turn observations into a decision. If your team is also reviewing broader financial measures, a resource on financial performance indicators for CEOs can help frame the difference between a marketing view and an executive financial view.
A monthly PDF can summarize what happened. An interactive dashboard gives the owner and team a way to ask what happened in a particular segment and then inspect the evidence. That's why useful dashboards show more than a headline number. They make the next question easier to answer.
The KPIs and Components Owners Should Track
Don't begin with a long list of metrics. Begin with business questions, then choose a measure for each one and only the filters needed to understand the result.
For a local service or retail business, the starting questions might be: Where do qualified inquiries come from? Which pages lead to contact on phones? Are paid campaigns bringing sales or just clicks? Do real visitors experience a fast, stable website? Each answer belongs on the screen only if someone can act on it.
Keep the screen readable
A useful dashboard usually combines a headline KPI, a trend over time, a comparison, a segment filter, and a path to the underlying records. In plain language, that means showing the current result, whether it's changing, what it can be compared with, which group you're looking at, and how to check the details.
Website speed is one place where specific measures can help. Google's Core Web Vitals describe loading speed, responsiveness, and visual stability. Google's “good” thresholds are measured at the 75th percentile of page visits, so the dashboard should show mobile and desktop separately and report the share of visits meeting each threshold, not just a single office test or average score (Google's Core Web Vitals guidance).
| Metric | Good threshold | Owner question |
|---|---|---|
| Largest Contentful Paint (LCP) | 2.5 seconds or less | Does the main page content load promptly for visitors? |
| Interaction to Next Paint (INP) | 200 milliseconds or less | Does the page respond promptly when someone interacts? |
| Cumulative Layout Shift (CLS) | 0.1 or less | Do page elements stay visually stable while the page loads? |
Those thresholds are useful only when connected to the customer journey. Pair them with sessions, qualified inquiries, and conversion rate so you can ask whether a slow mobile experience coincides with fewer contacts. To review how competitors appear in search results, a guide to B2B SaaS share of voice platforms may also help clarify what visibility tools measure. For your own dashboard, though, prioritize the questions tied to your customers and revenue.
Operational vs Strategic Dashboard Uses
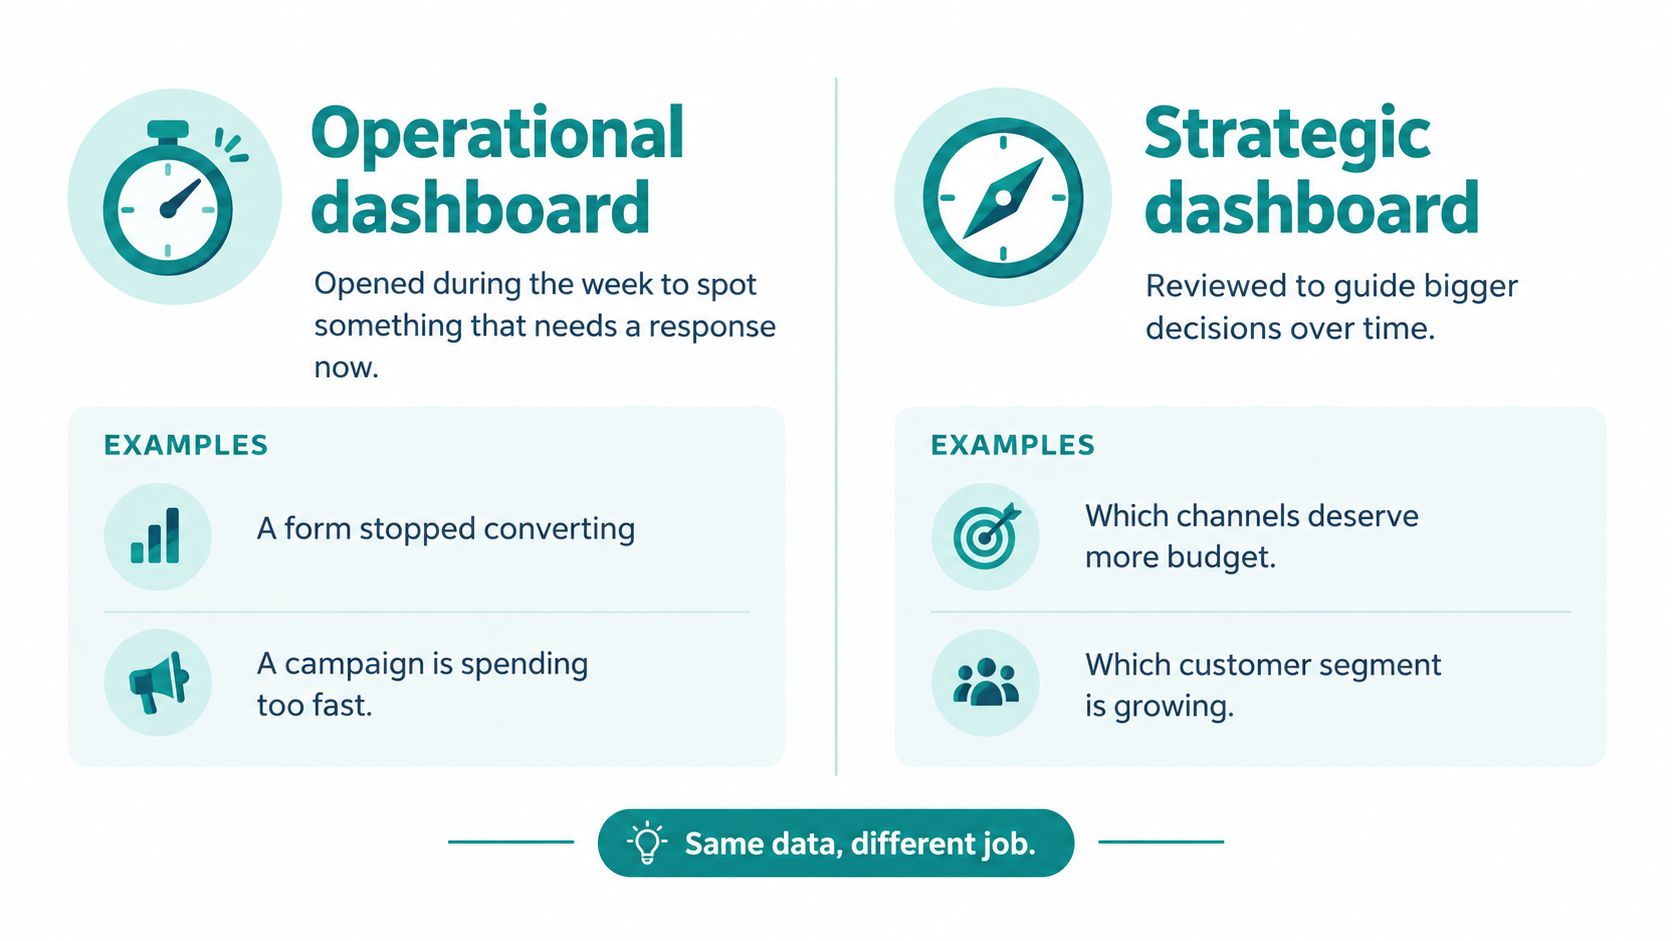
The same underlying business data can serve two different jobs. An operational dashboard helps staff spot something that needs attention during the week. A strategic dashboard helps the owner decide where to focus over a longer period.
Operational view for the team
The front desk, marketing staff, or location manager may need to catch a form that has stopped converting, a sudden drop in calls at one location, a campaign spending too quickly, or a mobile page that has become slow. The operational screen should be focused and quick to scan. Its purpose is to help someone investigate and respond, not to explain the company's full performance history.
The owner's strategic view serves a different audience. It can use a longer date range and fewer measures to support decisions such as whether to invest in new SEO pages for a service line, whether a redesign improved inquiry quality, or which local market merits a campaign. Those are not usually decisions to make from a single day's fluctuation.
If the screen won't change a decision this week, keep it off the daily view.
Before choosing software, write down one weekly question and one quarterly question. For example: “Did our main service form produce qualified inquiries this week?” and “Which service line deserves more investment next quarter?” If you can't name the decisions, you're not ready to choose charts.
Helbling Digital Media's analytics and conversion work can support both rhythms, but the distinction is about how your team uses the information. A related data-driven marketing strategy should also connect reporting to actions, rather than treating measurement as an end in itself.
Design Practices That Keep Numbers Trustworthy
A dashboard earns trust when people can see how its numbers were defined, where they came from, and who is responsible for them. A polished chart cannot fix unclear definitions or an outdated feed.
Start with a metric dictionary that defines each calculation in plain language. Name an owner for every metric, show the date range and active filters, and label when the data last refreshed. Give users a way to trace a result back to its source records. Without these controls, two people can read the same label and count different things.
Put ownership behind the screen
For a local service business, lead quality and website speed belong beside marketing results. A rise in form submissions means little if the inquiries are poor fits. A fast increase in visits can also hide a slow mobile page that stops customers from contacting you. Show how these measures are defined, where each comes from, and who checks them.
Set a clear process for changes. Decide who approves a KPI definition, who checks for changes in connected systems, and who corrects a published result when it is wrong. Post-launch ownership matters: assign someone to review definitions, refresh status, and data issues after the dashboard goes live. An unowned dashboard will drift.
Test real tasks, not just the design
Ask the vendor to walk through a real example with your team. Can staff spot a drop in qualified leads, identify the affected service or location, and open the records behind the total? Can they tell whether a result changed because of a filter, a definition, or a new data refresh? Test the steps your team will use, not just whether the screen looks clear.
Before launch, ask who validates the figures and how often, how quickly source changes appear, and how users can report a mismatch. Keep the answers in writing, with a named owner for each responsibility. Clear data visualization practices make results easier to read, while Fitness GM's gym data analysis guide offers another practical perspective on using analysis in day-to-day operations. A dashboard becomes a decision system when its figures are traceable and someone is accountable for keeping them accurate.
How to Choose Tools and a Local Partner
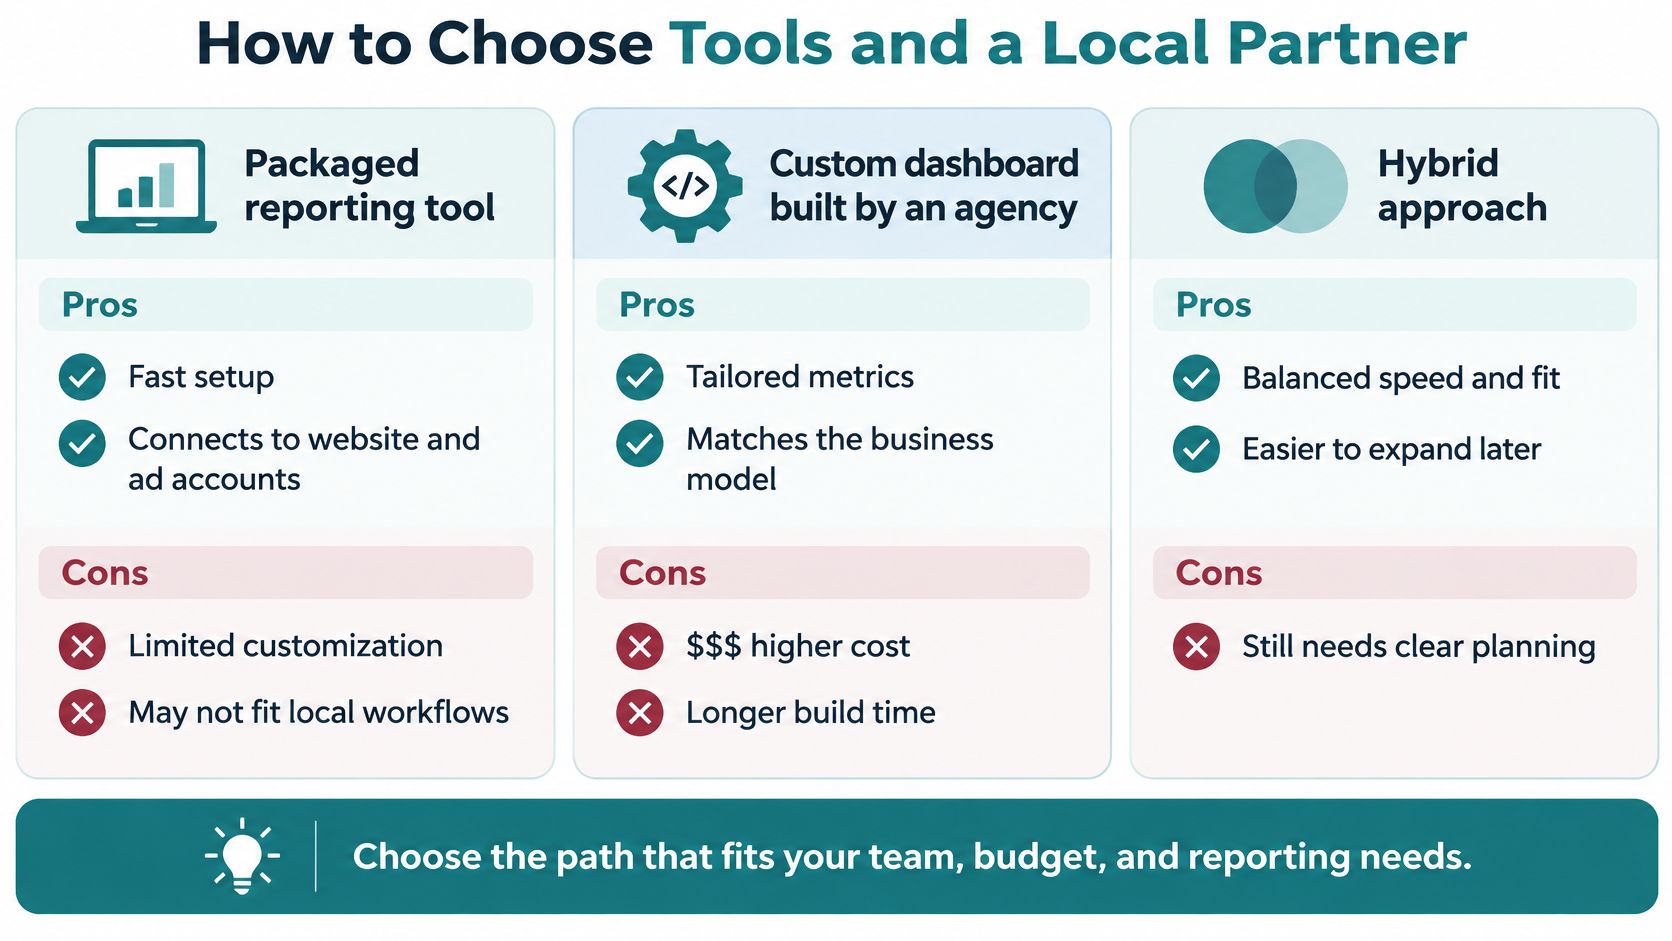
The right setup depends on what you need to connect, who will use the report, and who will maintain it when your marketing or business changes. A packaged tool, a custom build, and an agency-managed setup can all work. None is automatically right for every Cincinnati business.
Compare the paths
| Approach | Best fit | Trade-off to check |
|---|---|---|
| Packaged reporting tool | A business that needs a quick view of website and advertising accounts | It may not match the way your team defines qualified leads or runs locations |
| Custom dashboard | A business with a distinct workflow or several systems that need to work together | Custom work needs a clear scope and an ongoing plan for changes |
| Hybrid setup | A team that wants a faster start but may need tailored reporting later | It still needs agreed definitions and someone responsible for upkeep |
For any path, ask whether nontechnical users can filter the report without exporting data to a spreadsheet. Ask which systems it connects, who changes metric definitions, and whether an unusual total can be traced back to filtered records. A scholarly knowledge-graph dashboard study supports this decision pattern: define the questions first, map each to a KPI, and preserve a path from summary measures to the underlying detail (study of an interactive dashboard).
Helbling Digital Media is a Springboro agency serving Greater Cincinnati, with work spanning custom dashboards and integrations, analytics and conversion optimization, SEO, paid media, and website maintenance. Its industry experience includes healthcare, legal, real estate, hospitality, professional services, manufacturing, e-commerce, and sports. For healthcare, ask specifically whether the proposed experience fits your HIPAA and privacy requirements; don't assume that a dashboard or integration is suitable without reviewing the details.
A proposal should explain the business questions, data sources, definitions, user access, update cadence, and post-launch ownership. You can review HDM's analytics and dashboard solutions alongside other options, then compare proposals on those practical criteria rather than on visual polish alone.
Industry Dashboard Examples and a Next Step
A dashboard should reflect the decision a business needs to make. A healthcare team may want to see appointment demand beside patient-experience follow-up, so it can decide where to adjust outreach or service operations.
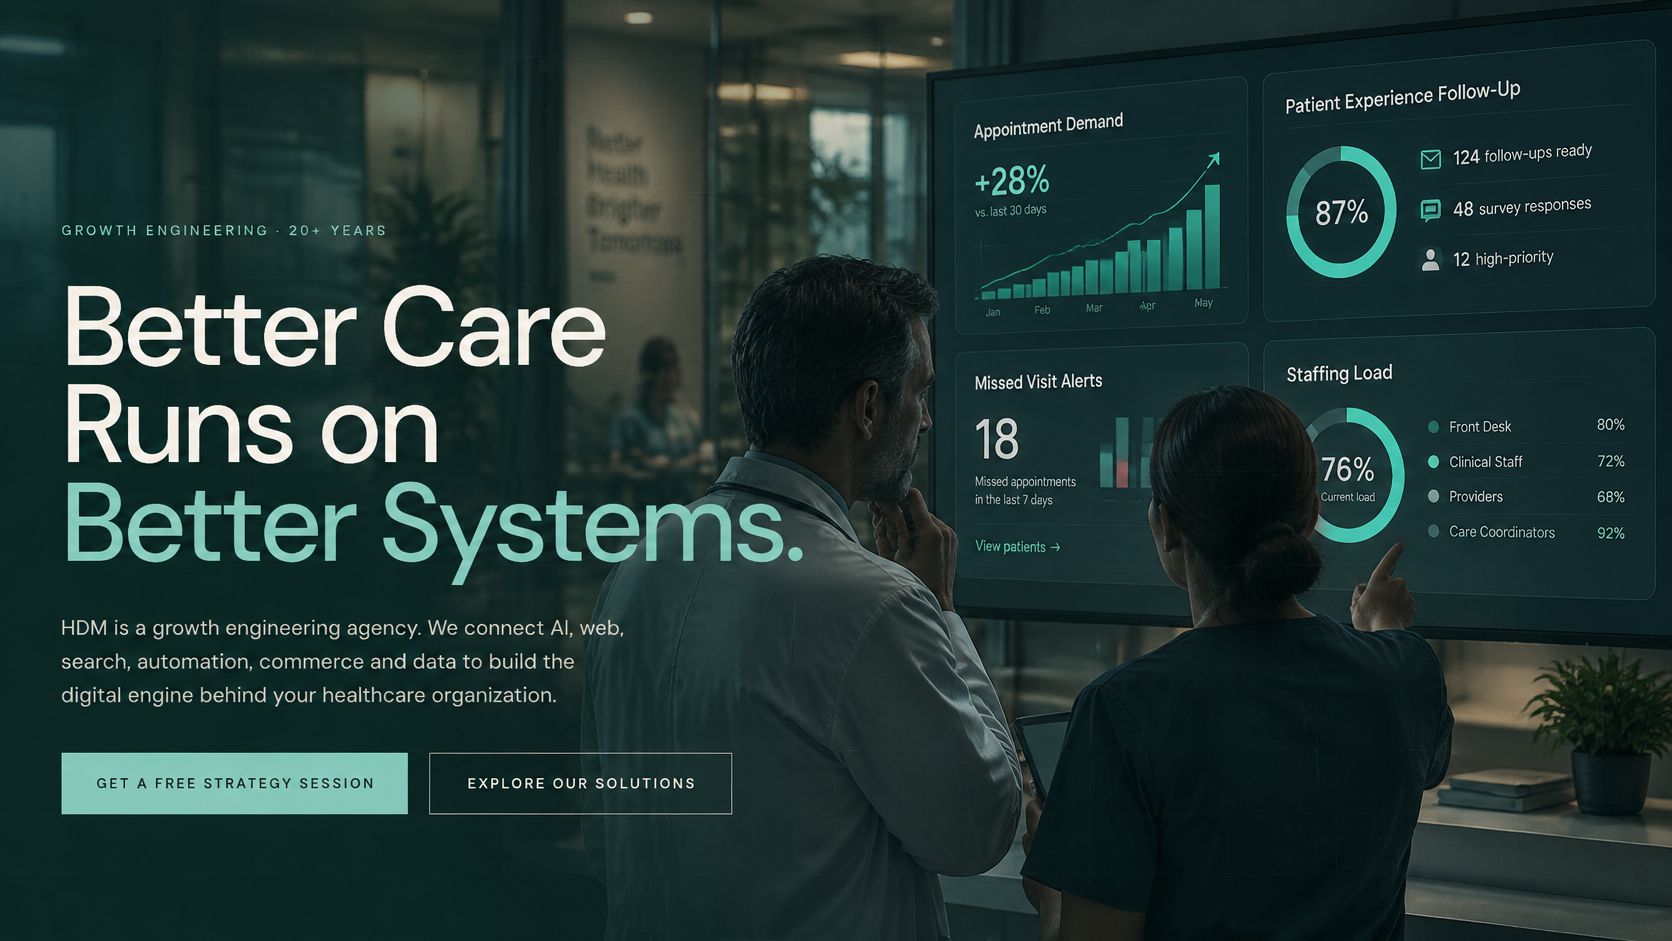
A law firm could track qualified consultations by practice area and decide which services need clearer website content or more focused campaigns. A retailer or e-commerce brand could connect campaign activity to orders and use the result to assess where to shift attention. A manufacturer or professional firm might compare inquiries by service line to decide which offering deserves new marketing support.
Add useful local context
Company results tell only part of the story. The U.S. Census Bureau's Business Formation Statistics can be viewed by geography, six-digit NAICS industry, legal form of organization, and employment-size class. Listed size categories range from 1–4 employees through 1,000 or more employees (Census Bureau business data).
A Greater Cincinnati business could use that market context alongside its own sessions, qualified inquiries, and conversion rate when considering where to focus SEO pages, paid campaigns, or outreach. Keep the Census geography and reporting period consistent so comparisons remain meaningful. The decision is not whether local business formation and your website data measure the same thing. They don't. It's whether outside market context helps you decide where to investigate next.
A short video can help your team discuss how dashboard data supports business decisions. Use it as a conversation starter, then bring the discussion back to your own questions and source systems.
<iframe src="https://www.youtube.com/embed/Al2aetj2Elo" width="100%" height="400" frameborder="0" allowfullscreen></iframe>This week, write down three questions your business needs to answer each month. Name the source for each number, then ask a web or marketing partner to show how those answers would appear for mobile and desktop visitors, including how your team can inspect the records behind a result.
Helbling Digital Media offers custom dashboards and integrations, analytics and conversion optimization, and ongoing website maintenance to help keep reporting useful after launch. Visit Helbling Digital Media to discuss a dashboard built around the decisions your Greater Cincinnati business needs to make.