

You've refreshed your website, added chat, and started paying for ads. The site looks professional on your laptop, but the contact form is still quiet, or shoppers keep leaving without buying. At your next marketing meeting, someone suggests another redesign. Before approving it, you need a better answer to a simpler question: where are potential customers getting stuck?
A useful conversion optimization strategy starts with that question, not a new layout. For a Cincinnati business with limited traffic and a carefully managed budget, the priority is to identify a real obstacle, fix it economically, and establish whether the change helped generate worthwhile business.
Why Most Cincinnati SMBs Are Optimizing the Wrong Things
Consider a Cincinnati service business reviewing its website after a disappointing month. The owner likes the photography. The designer likes the navigation. The advertising report shows visitors arriving. Yet nobody can explain how many people started the inquiry form, encountered an error, or called instead.
That's a hypothetical scenario, not a client case study, but it captures an important distinction: a website can look finished while its measurement remains incomplete.
Changing the homepage at that point does not resolve the uncertainty. It introduces another variable. If inquiries improve, the team may not know whether the design helped, a campaign attracted better prospects, or demand changed.
Diagnosis before decoration
Diagnostic optimization starts with observed behavior. A form rejects valid phone numbers, customers can't locate delivery information, or mobile visitors struggle to select an appointment.
Speculative optimization starts with preference. Someone wants a carousel, a different button color, or personalized greetings because a competitor uses them.
Design matters, but it should answer an identified problem. Before accepting a proposal, ask:
- What evidence supports this change? Request the affected funnel stage, customer observations, and tracking checks.
- What business outcome should improve? A completed purchase or qualified inquiry matters more than a decorative interaction.
- What's the smallest useful intervention? Clarifying a confusing field may deserve attention before rebuilding the entire page.
For a plain-language introduction to the discipline, see how Polish boosts conversions, then evaluate any proposed tactic against your own customer evidence.
Practical rule: Don't authorize a redesign to solve a problem nobody has defined.
For Greater Cincinnati SMBs, this approach keeps the conversation grounded in business decisions. A retailer needs profitable orders. A contractor needs inquiries within its service area. A professional practice needs prospective clients it can serve.
Your quarterly review should explain what prevented those outcomes, what changed, and how confidently you can connect the change to results. A list of completed design tasks isn't enough.
Mapping Your Funnel Before You Change Anything
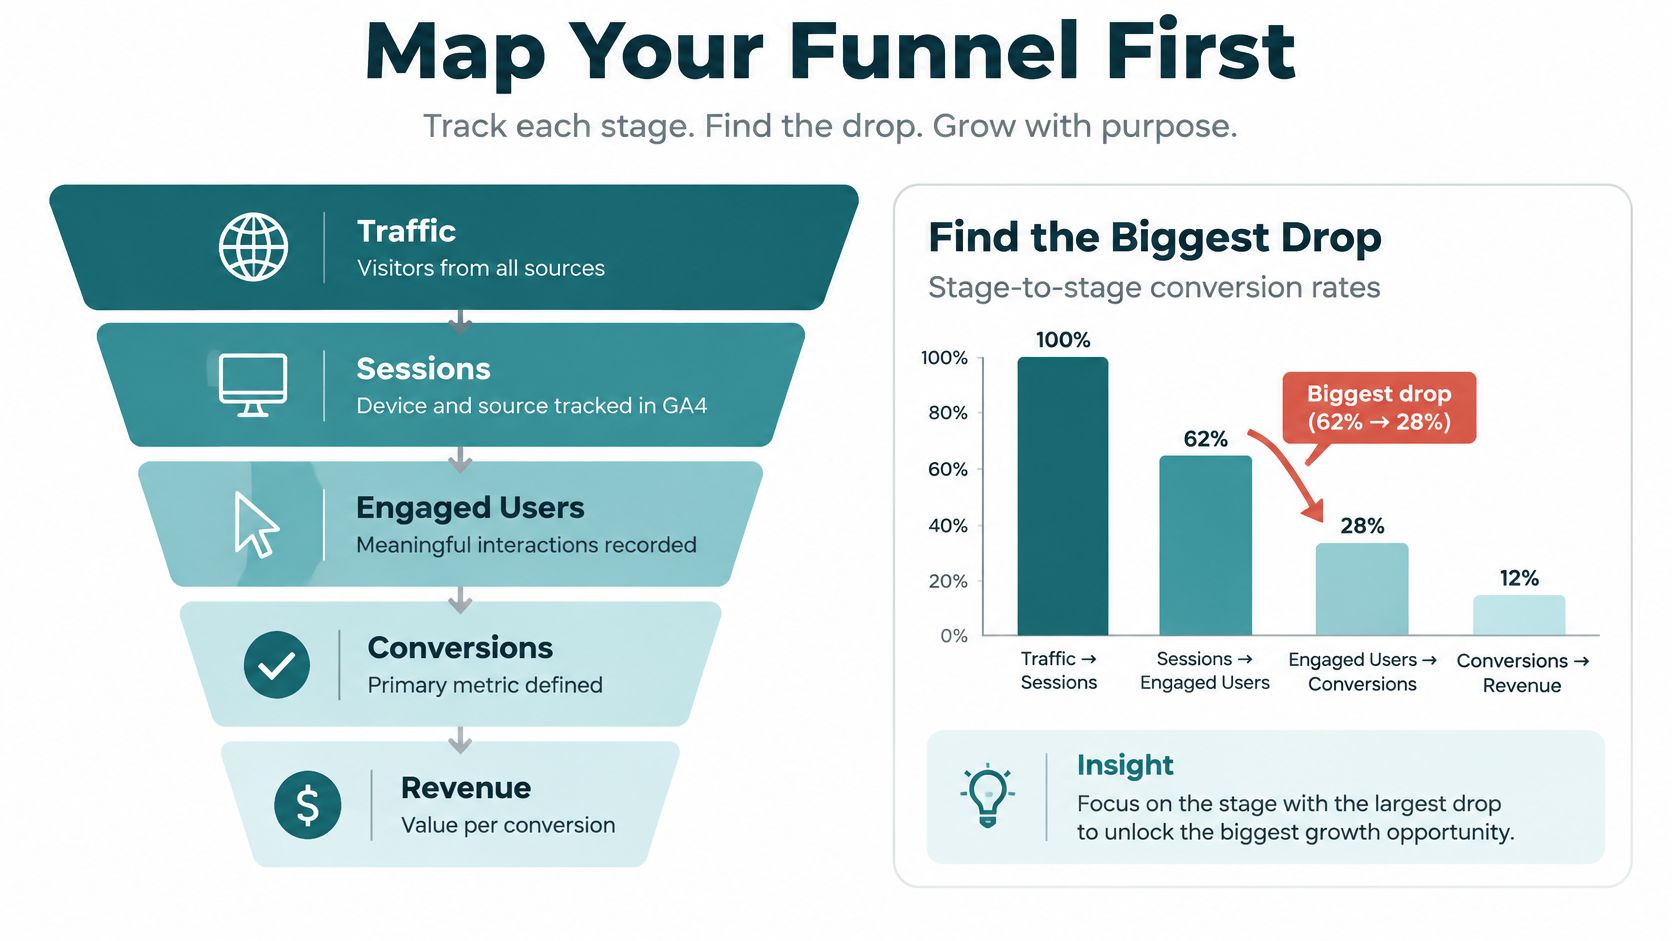
Start with the customer's path, not the reporting dashboard. For an online store, that might mean product view, cart, checkout, payment, and completed order. For a local service business, map service-page visit, contact-page visit, form start, successful submission, and qualified appointment.
Use Google Analytics 4 or a comparable analytics tool to record those transitions. Check mobile and desktop separately, then compare traffic sources. Verify that a successful submission means the business received the inquiry, not merely that someone clicked a button.
Use this funnel map to organize the measurement conversation.
Pair the numbers with observation
Find the largest credible drop-off, not the most alarming percentage. A dramatic exit rate from a scarcely visited page may deserve less attention than a persistent checkout problem affecting substantial business.
Then watch customers attempt the task. Recruit five to ten real customers for a lean round of moderated usability testing, treating that as a practical research plan rather than a statistically representative survey. Ask them to find a service, request an estimate, or complete a purchase without coaching them.
Combine those conversations with privacy-conscious session observation. Don't record payment details, health information, or confidential intake responses.
Baymard's model illustrates the value of combining methods: its research includes 272 moderated sessions and nine quantitative studies involving 11,777 participants. Its benchmark found 65% of 344 major US and EU stores had mediocre-or-worse checkout usability, while only 2% rated good, according to its checkout usability report and benchmark.
Create an issue inventory
Give each observed problem a written entry:
- Location and audience: Identify the step, device, traffic source, and relevant geography.
- Evidence: Record the analytics pattern and observed customer difficulty.
- Business exposure: Describe affected traffic, potential revenue, and severity.
- Delivery effort: Estimate implementation work and note dependencies.
- Confidence: Separate directly observed failures from plausible explanations.
For a store, an entry might describe customers searching unsuccessfully for guest checkout. For a professional service firm, it might describe uncertainty about what happens after submitting an inquiry. These are hypothetical diagnostic examples, not measured outcomes.
An internal marketer, independent analyst, or agency analytics team can run this process. The deliverable should be a prioritized inventory with supporting evidence, not just access to another dashboard.
Turning Friction into Testable Hypotheses
A Madeira home goods store sees the same pattern every week. Shoppers reach the cart, check the total, and leave. Analytics confirm the exit point, session recordings show hesitation on the shipping line, and the owner wants the whole checkout rebuilt. Nothing in that evidence justifies a rebuild. It justifies one sentence:
Because we observed this behavior, changing this element for this audience should improve this business metric by a pre-agreed worthwhile amount.
"Improve checkout" cannot be tested. "Show the shipping estimate in the cart, because customers exit when delivery charges appear" names the change, the audience, and the reason, and it gives the team a result to accept or reject. The final amount must come from your economics and testing capacity, not an attractive industry benchmark. It's a target to evaluate, not a promised result.
Match the test to the type of friction
Retail friction usually sits in the money conversation. For the store above, a reasonable test displays shipping charges, calculable taxes, and fees before payment, requesting a ZIP code when delivery cost depends on location. 48% of shoppers in Baymard's survey cited excessive extra costs as an abandonment reason, and 16% could not see the total order cost upfront, according to its checkout abandonment statistics. Those figures tell you where to look first. They do not prove your store loses sales for the same reason, which is why the hypothesis exists in writing.
Service businesses lose people at the conversation step instead. A Montgomery estate attorney's intake form may collect every required field and still stall, because visitors cannot tell who replies, what the first call covers, or whether submitting commits them to anything. The test adds one paragraph answering those questions and measures completed inquiries. Only promise a response your staff can deliver on a busy Tuesday. When the team cannot separate observed behavior from educated guessing, running structured user tests produces the direct observation a hypothesis needs.
Rank hypotheses in writing, then defend the ranking
Scores exist to force the argument into the open. Rate each candidate against three questions before anyone volunteers an opinion:
| Factor | The question behind the score |
|---|---|
| Impact | Would removing this obstacle move a number the owner actually tracks? |
| Confidence | Do analytics and observed behavior point to the same explanation? |
| Ease | Can the team ship and measure the change without displacing bigger problems? |
A weekly review of this table can stay under thirty minutes when participants read the evidence beforehand. Unexpected costs, forced account creation, excessive complexity, and missing payment options belong on every checkout inspection list, because they recur across retail audits.
Easy and worthwhile are different axes. A headline tweak backed by a hunch should never outrank a broken payment interaction backed by recordings. Pick the smallest change that removes the actual obstacle, rather than the smallest change available.
Running A/B Tests That Small Teams Can Trust
A Cincinnati service firm gets a decent contact page, steady local traffic, and a owner who wants the phone to ring more often. The tempting move is a new hero image. The better move is cheaper: write down which completed action would prove the page is doing its job, then test only the change that could move that action.
An A/B test compares the current experience with one controlled alternative. The hard part is agreeing before launch what result would earn a rollout, what result would send the team back to the recordings, and what result is too small to justify touching the page again.

For context, Baymard reports approximately 70.22% cart abandonment, estimates 35.26% potential average conversion improvement from better checkout design for large stores, and compares 19.9 average form elements with approximately 12 in an optimized flow in its checkout-flow optimization research. Those are retail benchmarks and estimates, useful for sizing effort, risky as a promise to a Cincinnati law office, clinic, contractor, or boutique.
Decide what would change your mind
Pick one primary conversion metric before anyone mocks up a variant. For ecommerce, completed purchases. For healthcare or legal services, qualified appointment or matter-intake completion, with privacy requirements respected in the analytics setup. Clicks, scroll depth, and time on page can explain a result; they should not crown one.
Define the smallest improvement worth paying for, then calculate the sample from baseline conversion, traffic allocation, and that intended effect. Freeze the variants, duration, and decision rules in writing. If the plan survives only while the graph looks friendly, it was a mood, not a test.
Estimate possible upside with Traffic × baseline conversion × expected relative uplift × average order value, then discount it for uncertainty and implementation cost. For another planning resource, review how Otter A/B frames testing beside your written experiment plan. When a page is the constraint, tighten scope with landing-page practices that keep one variable in view instead of letting a test sprawl into a redesign.
A six-to-eight-week calendar can keep one designer, one developer, and one analyst honest. It cannot manufacture conversions that never arrive. Watch refunds, support contacts, page speed, and lead quality while the test runs, because a winning submit button can still create worse inquiries.
Use the following video as supplementary material for the testing discussion.
<iframe src="https://www.youtube.com/embed/VuKIN9S8Ivs" width="100%" height="400" frameborder="0" allowfullscreen></iframe>Ship when the evidence supports a worthwhile improvement without unacceptable guardrail damage. Iterate when observation points to a better explanation. Stop when the idea fails or costs more to evaluate than it could plausibly return. An inconclusive test is tuition, and the invoice should buy a sharper next question.
Personalization, Segmentation, and What Actually Pays Off
Showing every visitor a customized experience sounds refined. For an SMB, it can also create a collection of experiences too small to evaluate.
Segmentation means examining meaningful groups separately. Personalization means changing what those groups receive. Start with the former before investing in the latter.
Compare new and returning visitors, traffic sources, and devices. Look for different needs, not just different conversion rates. A returning shopper may need a straightforward route back to products; a new service prospect may need clearer explanations of fit and process.
Personalization Playbook by Traffic Level
There's no defensible universal monthly-visitor threshold for these decisions. Use eligible conversions and required sample size, not a borrowed traffic cutoff.
| Monthly Visitors | Safe to Personalize | Avoid Until You Scale |
|---|---|---|
| Limited traffic, sparse completed conversions | Clear campaign-specific pages and user-selected preferences | Numerous automated audience variants |
| Enough traffic to evaluate a broad segment | A focused source-based or new-versus-returning test | Splitting audiences into many overlapping groups |
| Sustained traffic with adequate samples per segment | Validated recommendation rules and controlled audience experiments | Assuming every subgroup needs a different experience |
Adapt to the business, not the novelty
For healthcare, design HIPAA-aware intake around necessary information and appropriately reviewed technology. Don't use sensitive patient details to make a page feel more personal, and don't assume an analytics configuration is acceptable without privacy review.
For a law firm serving the Cincinnati region, clarify relevant jurisdictions and service scope using truthful information. That can be more useful than inferred personalization that guesses where the visitor needs representation.
For Shopify and WooCommerce stores, start with understandable recommendation rules, such as relevant complementary products. Check whether recommendations add profitable purchases or distract shoppers from completing an order.
If shopping campaigns need a clearer product structure, product segmentation for Google Shopping is a relevant planning resource. Keep campaign organization distinct from proof that personalized website content works.
A segment deserves a different experience when you can explain its different need and evaluate the business outcome.
Apply that same discipline to accessibility. Identify a concrete task barrier, define who encounters it, and evaluate whether people can complete the task after the fix. Unlike optional personalization, a clearly broken interaction shouldn't wait for an experiment before you repair it.
Measurement, Attribution, and the Quality Behind the Numbers
A plumbing company's form submissions double in a quarter. On paper, a win. Then the office manager reports that half the new inquiries sit outside the service area, or want a price the business can't profitably match. This is the pattern I see most on underperforming Cincinnati SMB sites: more conversions on the dashboard, thinner margins in the bank account, and staff doing unpaid qualification work.
The fix is to build reporting around business quality, not website activity. Pair acquisition spending with acquired customers. Assess customer value using defensible records. Connect inquiries to appointments, accepted matters, or completed sales.
Match every metric to a business question
| Dashboard metric | The question it should answer |
|---|---|
| Conversion rate | Are qualified customers completing the action? |
| Cost per lead | What does an accepted lead or booked job actually cost? |
| Traffic by channel | Which sources produce customers, not just sessions? |
| Form abandonment | Where does a real task break down? |
Attribution deserves the same skepticism. Last-click records the final identifiable touchpoint, which rarely describes how a Cincinnati buyer found you. Add sales progression, assisted conversions, and a short "how did you hear about us" field to intake forms. This overview of multi-touch attribution can frame that conversation without pretending every interaction is observable.
AI referrals need the same restraint. A 2025 analysis described a paired comparison across 54 sites, with organic traffic converting at 4.6% and LLM referrals at 4.87%, a difference that wasn't statistically significant; it also reported different patterns for B2B and B2C in its discussion of websites in the age of AI search. That's no basis for declaring AI visitors superior. Segment by intent category and landing-page type, then review qualified pipeline, branded discovery, direct visits, and customer-reported discovery alongside referral data.
Quality checks belong in the same report. A 2025 European e-commerce audit found 94% of audited checkout flows below its accessibility threshold, while only 2% permitted completion without a major accessibility barrier, according to the Contentsquare Foundation accessibility report. Those figures don't describe your site, but they're a good reason to watch a real customer complete a purchase by keyboard, read the error messages your forms produce, and count how often failures turn into abandoned orders or calls for staff help.
Reviews carry a separate obligation. The FTC's Consumer Reviews and Testimonials Rule guidance prohibits misrepresenting controlled review properties as independent and warns against sentiment-conditioned incentives and undisclosed material relationships. Ask for honest feedback, disclose incentives appropriately, and use testimonials that reflect actual experience and supportable claims.
The measurement question, stated plainly: can customers act successfully, can you verify the resulting revenue, and are you persuading them truthfully? If any answer is no, a higher conversion rate is decoration.
How to Prioritize the Next 90 Days
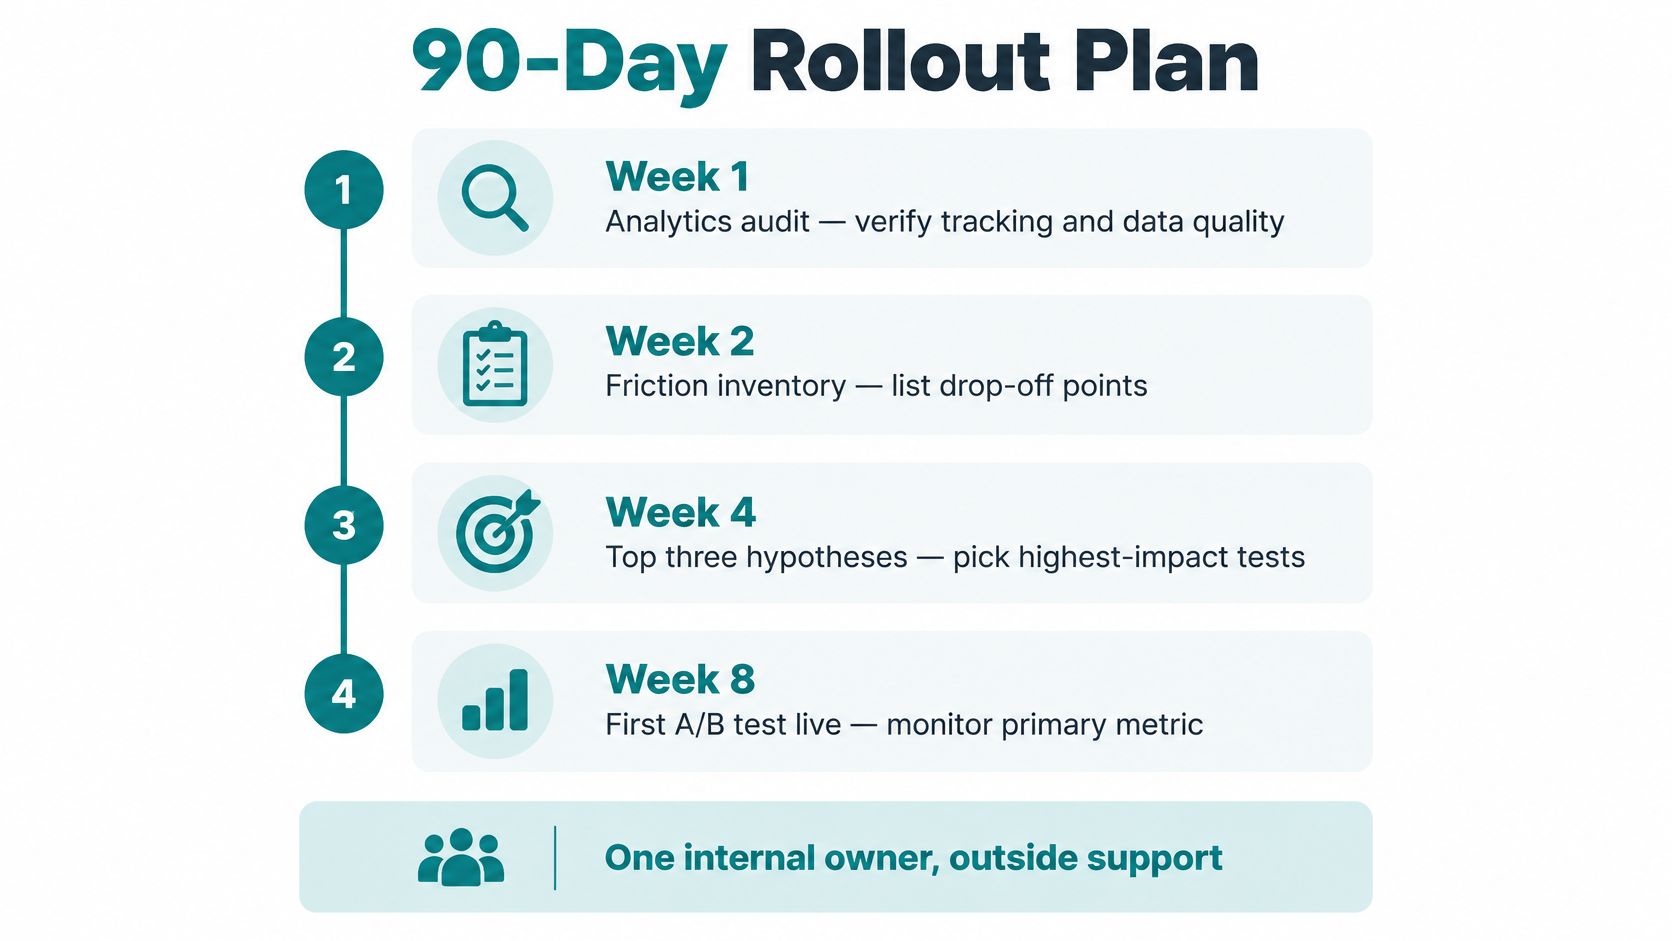
Assign one internal owner who can coordinate marketing, operations, and outside specialists. Build the schedule around deliverables, with experiment completion dependent on sample requirements rather than calendar pressure.
Use this timeline to organize the rollout.
Sequence the work
- Early deliverables: Audit analytics, produce the friction inventory, and select the top three hypotheses. Prepare the first two tests, launching sequentially where necessary.
- Middle-stage delivery: Introduce useful segmentation, connect lead-quality records, and repair confirmed accessibility barriers.
- Late-stage decisions: Assess what to scale, consider a tightly scoped AI-search pilot, and complete the quarterly business review.
Don't promise that every test will finish within the rollout. A credible finding is worth more than a forced declaration.
Bring a readable scoreboard
Use your next leadership meeting to check:
- Measurement readiness: Primary outcomes reconcile with operational records.
- Evidence quality: Each priority has documented support.
- Commercial performance: Completed outcomes retain acceptable quality and margin.
- Decision clarity: Every experiment has a ship, iterate, stop, or inconclusive status.
- Execution capacity: Someone owns implementation and follow-up.
Bring in specialized support when tests stall, attribution remains confusing, or a rebuild could disrupt measurement. A local agency can work alongside your internal owner to handle research, implementation, and analysis without taking business decisions away from your team.
Helbling Digital Media offers analytics, conversion optimization, web design, and development for businesses across Greater Cincinnati. Visit Helbling Digital Media to discuss an analytics audit and prioritized testing plan, so your next website investment addresses documented obstacles rather than another round of guesswork.