


Marketing analytics is the practice of collecting data about your marketing and customers and using it to decide where to spend time and money.
You might be paying for a redesigned website, SEO, or ads while still wondering why the phone isn't ringing more often. Your reports show visits and clicks, but your office manager sees open appointment slots. For a Cincinnati-area business owner, useful measurement starts by connecting those two views, not by adding another dashboard.
What Marketing Analytics Means for Your Business
Marketing analytics turns observations into decisions. Think of your car's dashboard: it doesn't drive the car, but it shows your speed, fuel level, and warning lights so you can act. A marketing report should serve the same purpose, helping you decide whether to change an offer, repair a page, or reconsider spending.
Say you run a Cincinnati landscaping company and notice fewer estimate requests. You don't immediately need advanced software or a complete history of every visitor. You need a way to move from noticing the decline to understanding what deserves attention.
From observation to action
The Greenbook explanation of marketing analytics describes four analytical purposes, moving from describing results to recommending actions. Applied to the landscaping business, they look like this:
| Question | Landscaping business example | Useful response |
|---|---|---|
| What happened? | Contact-form submissions fell compared with the previous month. | Check where the decline occurred. |
| Why did it happen? | The decline followed slower contact-page loading. | Investigate performance before blaming demand. |
| What is likely next? | Past records suggest calls increase in spring. | Prepare advertising before the seasonal increase. |
| What should we do? | A service page produces stronger inquiries than a general campaign. | Test directing more spending toward that service. |
These are different levels of confidence, not interchangeable conclusions. A slowdown happening alongside fewer submissions is a clue, not proof that speed caused the decline. You'd check traffic sources, test the form, and consider seasonal changes before choosing a fix.
A data-driven marketing strategy connects that investigation to a commercial objective, such as profitable landscaping contracts rather than visits alone. That changes the conversation with a website or SEO provider from reporting activity to explaining choices. The practical test is simple: if a number wouldn't change a decision, it's reporting rather than actionable analytics.
Core Metrics and KPIs Every Owner Should Know
A metric is any number you can measure; a KPI, or key performance indicator, is a metric tied to a goal you've chosen. All KPIs are metrics, but not all metrics deserve a place in your main report.
For example, search impressions can help explain visibility, while qualified estimate requests help you judge customer acquisition. Both matter, but they answer different questions.
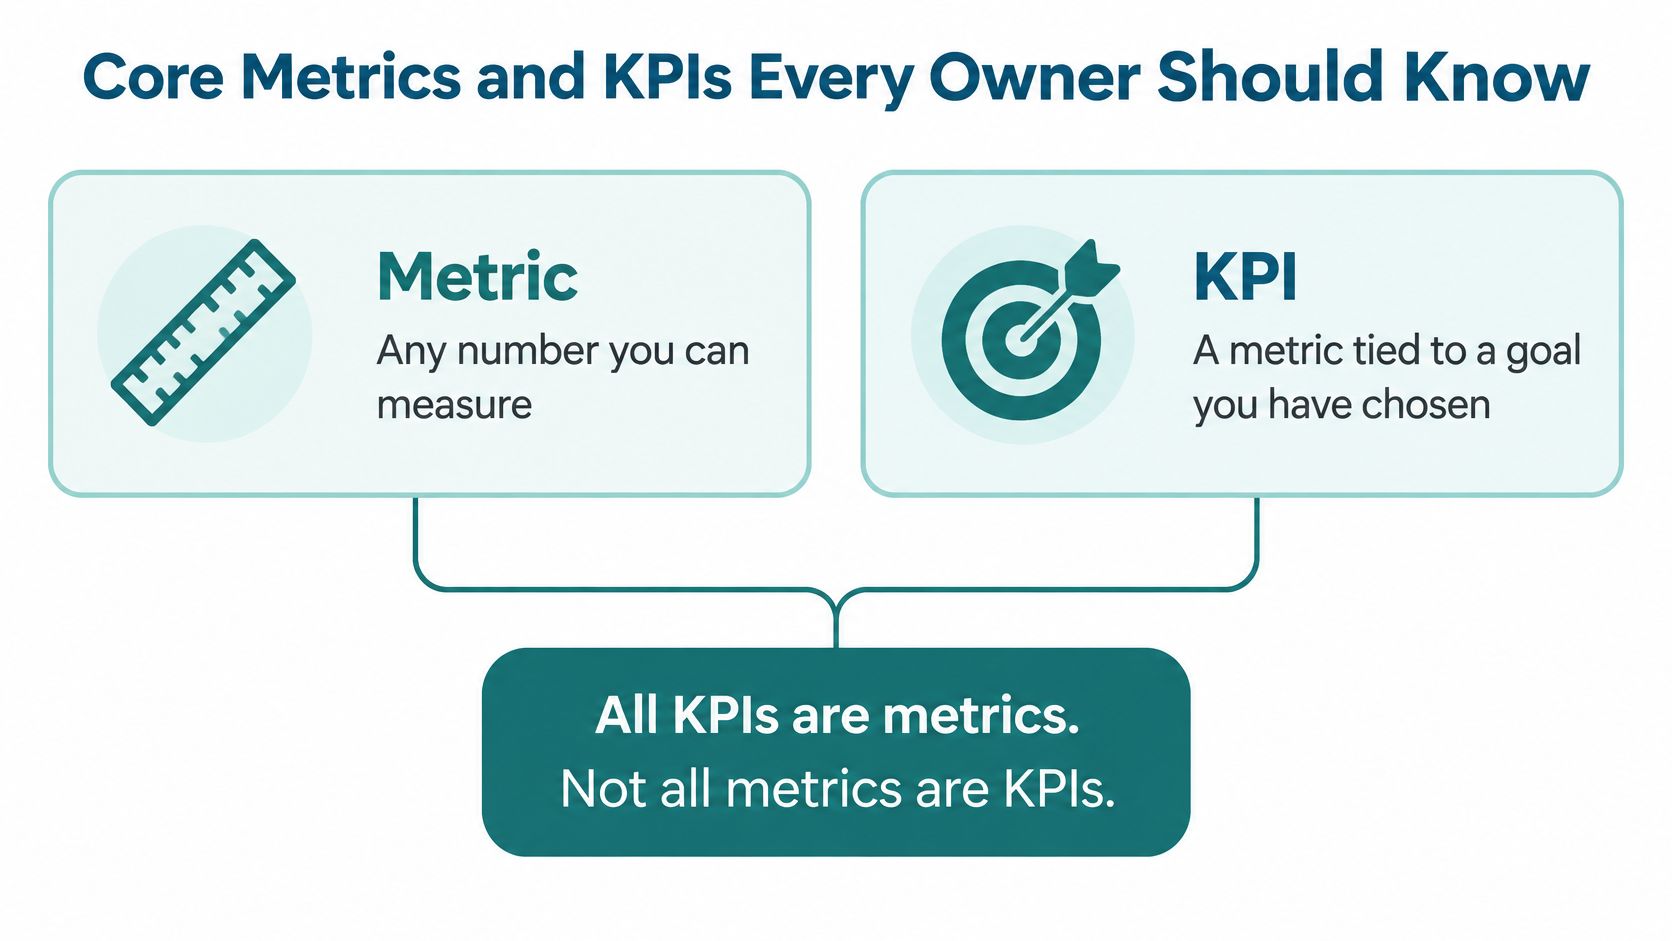
Core metrics and what they reveal
The examples below are calculations or practical measurement rules, not industry benchmarks.
| Metric | What It Tells You | Worked Example | Where to Find It |
|---|---|---|---|
| Conversion rate | Share of visitors who take a key action | Hypothetically, 6 contact forms from 200 visits is a 3% rate | Google Analytics 4 |
| Cost per lead | Spend divided by qualified inquiries | Divide campaign spending by inquiries that meet your qualification rule | Ad platforms and CRM |
| Customer acquisition cost | Total marketing and sales cost divided by new customers | Include advertising and sales follow-up costs, then divide by customers won | CRM and accounting records |
| Return on ad spend | Revenue earned for each dollar spent on ads | Divide attributed sales revenue by advertising spending | Ad platforms and sales records |
| Customer lifetime value | Profit expected from one customer over the whole relationship | Estimate repeat-service profit across the expected customer relationship | CRM and billing system |
| Core Web Vitals (LCP, INP, CLS) | Real-visitor loading, responsiveness and stability | Compare actual visitor experience with Google's good-performance thresholds | Google Search Console |
Organize your report into traffic, conversions, and business outcomes. Traffic includes sessions, meaning visits, and search impressions; conversions include submitted forms, calls, and conversion rate. Business outcomes include qualified leads, revenue, customer lifetime value, and return on ad spend.
Don't confuse revenue with profit. Return on ad spend doesn't deduct fulfillment, payroll, or other operating costs, and a cheap inquiry isn't valuable if it never becomes a suitable customer. For online retailers choosing sales-focused measures, Arlo Inc.'s guide to ecommerce KPIs with Arlo provides additional selection context.
Include website experience without mistaking it for sales
Google's Core Web Vitals guidance sets good targets of LCP at 2.5 seconds or less, INP at 200 milliseconds or less, and CLS at 0.1 or less, covering loading, responsiveness, and visual stability respectively. Use real-visitor measurements rather than relying only on a developer's test.
A page that loads quickly but shifts while someone tries to tap the contact button can still receive a weaker overall assessment. Treat that as a repair priority, not as a revenue result.
Selection rule: Choose the KPI closest to revenue that you can meaningfully influence within a month.
As a practical starting point, limit your main dashboard to three to five KPIs. Keep supporting measurements available for diagnosis rather than crowding the owner's report.
Tools Most Businesses Use to Track Marketing
Most businesses don't need every analytics platform. They need a tool for each unanswered question, starting with the free options that cover website activity, search visibility, and local discovery.
A useful buying test is whether a new platform will change a decision you can't already make. If nobody can explain that decision, postpone the purchase.
Common marketing analytics tools by job
| Category | Examples | Typical Cost | Question It Answers |
|---|---|---|---|
| Website analytics | Google Analytics 4 | Free | Who visits, where they come from and which actions they take |
| Search visibility | Google Search Console | Free | Which searches show your site and how often people click |
| Local presence | Google Business Profile insights | Free | How customers find your listing and call or request directions |
| Advertising | Google Ads, Meta Ads Manager | Free to access; you pay for ads | What each campaign costs and what it produces |
| Visitor behavior | Microsoft Clarity | Free | Where visitors click, scroll and stop |
| Reporting | Looker Studio | Free | How data from several sources appears in one shared view |
| Customer records | HubSpot CRM | Free tier and paid plans | Which leads became customers and what they were worth |
For a local dental office, Search Console helps explain search visibility, while Business Profile performance helps assess listing interactions. Google Analytics 4 shows what happens after someone reaches the website. Those are related questions, but the numbers won't necessarily match because the tools measure different activities.
Microsoft Clarity adds visual clues through click maps and session recordings. You might use it to investigate visitors struggling with an appointment form, but configure privacy controls and exclude sensitive fields before recording behavior. Looker Studio is useful when your team needs a shared view rather than separate account logins.
Connect customer records before buying more reporting
A CRM, or customer relationship management system, records what happens after an inquiry arrives. HubSpot is one option, but consistently maintained customer records matter more than the brand. Someone must update whether a lead booked, declined, qualified, or became a paying customer.
Without that follow-through, website reports stop at activity. A billing or accounting connection can then supply the revenue needed to evaluate customer value.
Before adopting a tool, check:
- Cost: What's included, and which features require payment?
- Portability: Can you export the underlying records?
- Connections: Can it exchange useful information with your CRM?
- Readability: Can your office manager understand the report?
For owners who prefer implementation help, Cincinnati-area agency Helbling Digital Media (HDM) offers website and growth-marketing work that can incorporate tracking before advertising begins. An internal team or another qualified partner can also handle setup, provided ownership and access remain clear.
How to Set Up Marketing Analytics Step by Step
Poor definitions and untested tracking can make a polished report unreliable. Set up measurement in an order that lets you verify each piece before relying on the results.
This overview groups the work into its main stages.
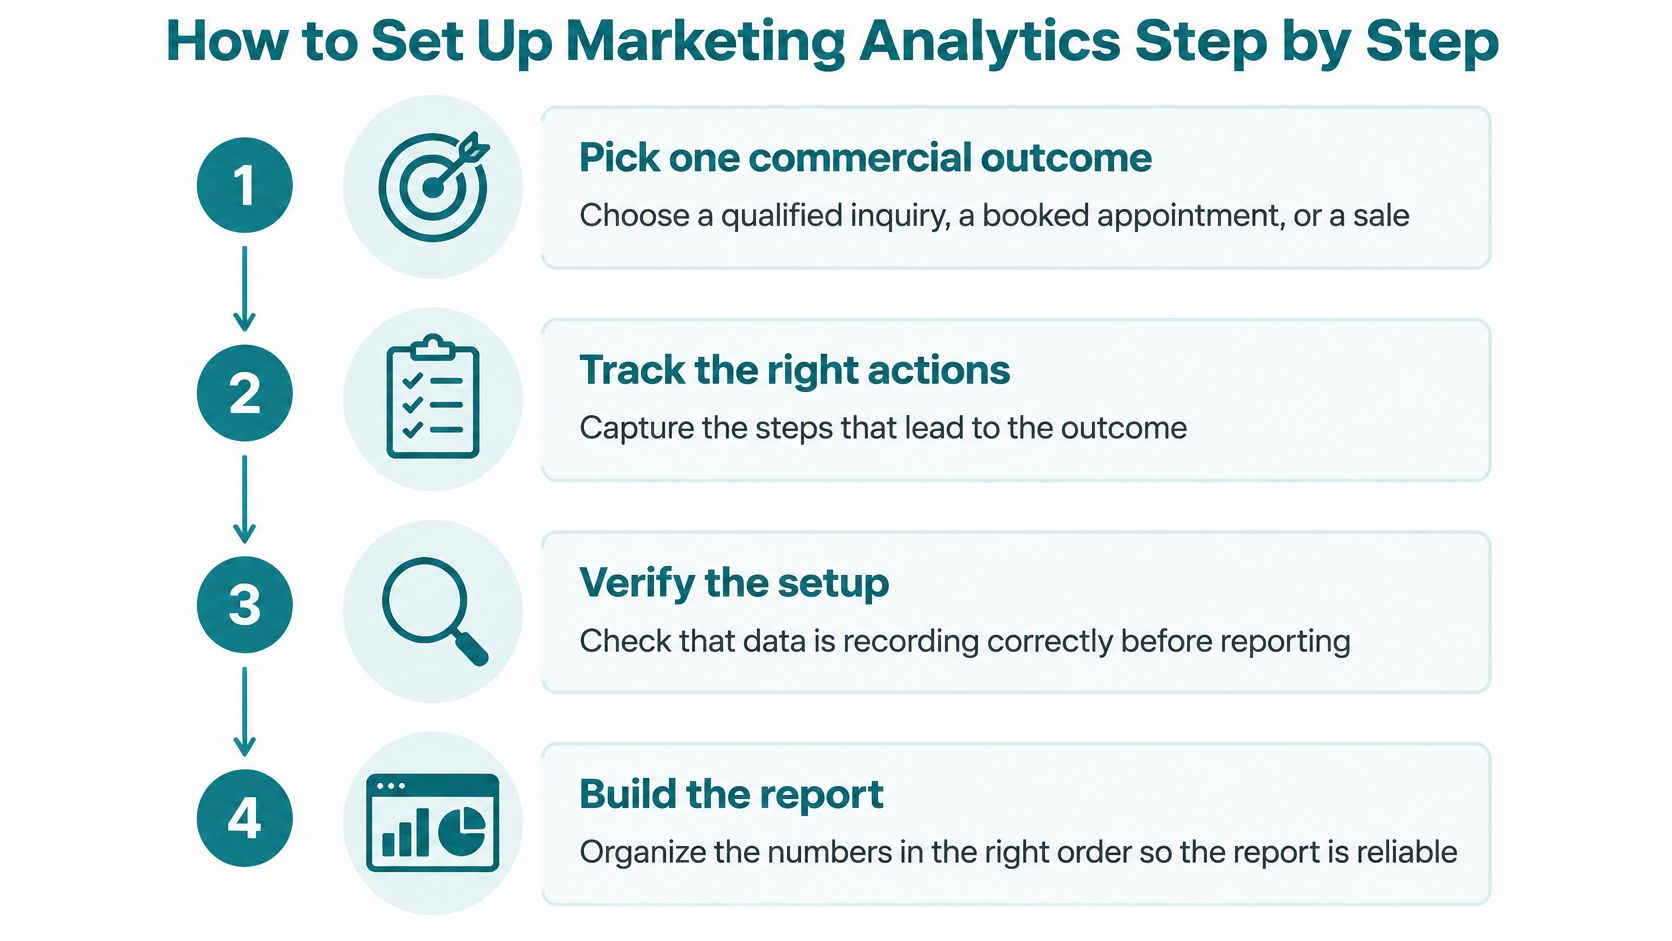
Build and verify the measurement
-
Pick one commercial outcome. Choose a qualified inquiry, booked appointment, or completed sale so the setup has a business purpose. A common slip is treating page views as success when the business needs consultations.
-
Define and name key events. Specify exactly what counts as a successful form submission, click-to-call tap, or booking confirmation, then use consistent names. Don't count a button click as a completed inquiry, or a phone tap as proof of a connected call.
-
Install tracking and test it yourself. Submit a test form and check the event in Google Analytics 4's realtime reporting, using debugging tools when needed. Check that a successful booking records once, not again whenever someone refreshes the confirmation page.
-
Standardize campaign tags. Use a documented pattern such as
utm_source=google,utm_medium=cpc, andutm_campaign=spring-hvac-2026for a hypothetical spring campaign. These labels identify the source, channel type, and campaign; inconsistent spelling can split one campaign into separate report entries. -
Connect relevant accounts. Link Search Console and supported advertising accounts to the analytics property, using approved integrations for other platforms. Check permissions and account selection carefully so you're not combining the wrong website or advertising account.
-
Assign ownership and simplify the dashboard. Give someone responsibility for maintaining definitions, investigating discrepancies, and presenting the chosen KPIs. The common mistake is assigning a report to everyone while making nobody responsible for accuracy.
Keep personal and sensitive information out of analytics event names, page addresses, and campaign tags. This deserves particular attention for healthcare and legal inquiries, where form contents aren't appropriate dashboard material.
For a supplementary walkthrough, use the video below alongside your own testing checklist.
<iframe src="https://www.youtube.com/embed/KYFZOg_L7Z0" width="100%" height="400" frameborder="0" allowfullscreen></iframe>Keep reporting settings consistent
Attribution means assigning credit to interactions that precede an important action. Google's attribution documentation lists three reporting models: data-driven attribution, paid-and-organic last click, and Google-paid-channels last click.
Choose a documented model for routine comparisons and keep it consistent. Compare alternative views when investigating channel performance, but do not change the model without notice and present the resulting difference as business growth.
Finish by reconciling like-for-like outcomes. Dashboard submissions should match corresponding CRM submissions within a small, explainable margin; qualified leads won't match all submissions because qualification happens later.
Why Attribution Can Mislead Small Business Owners
An owner sees that paid ads received the final click before a sale and concludes that the ads caused it. That's an understandable interpretation, but assigned credit isn't proof of additional business.
Say someone discovers a Cincinnati law firm through organic search, returns through a paid advertisement, and submits a consultation request. A reporting model may give the advertisement substantial credit, even if the prospect had already decided to contact the firm. Cutting SEO based on that report alone could mean removing the channel that introduced the prospect.

Ask what happened because of the campaign
A 2026 systematic review of 108 studies found that deep-learning attribution can improve predictive accuracy while remaining causally unidentified unless validated through experiments. In plain language, a model can become better at predicting who converts without proving which advertisement changed someone's mind.
Incrementality asks a different question: what additional result occurred because the campaign ran? A stronger test randomly withholds a campaign from an eligible comparison group, then compares outcomes with those of the exposed group. A geographic test can also help, provided the areas are suitably comparable and seasonal or competitive differences are considered.
Don't pause advertising in an arbitrary neighborhood and assume every difference is caused by the pause. Decide eligibility, duration, success criteria, and stopping rules before starting. With sparse inquiries, you may need more observation time rather than a more complicated model.
Make useful decisions with incomplete journeys
Offline referrals, missing CRM updates, and long consideration periods make customer-level reconstruction difficult for small firms. Use multi-touch attribution to investigate recorded interactions, not to promise complete visibility. Retailers comparing model choices can also consult Headline Marketing Agency's explanation of attribution modeling for eCommerce leaders, while keeping the distinction between credit and causation in view.
A practical approach is to:
- Anchor spending to outcomes: Evaluate qualified inquiries and completed business, not just platform conversions.
- Separate signals from results: Use engagement to investigate interest, without labeling it revenue.
- Record assumptions: Note missing referrals, delayed sales, and uncertain channel assignments.
- Test major changes gradually: Preserve a useful comparison instead of rebuilding every campaign simultaneously.
Perfect tracking is not the goal; decisions that improve with each month of evidence are.
A Monthly Reporting Routine That Changes Decisions
A report without an action trigger is just a chart. Before reviewing performance, decide who will investigate a change and what evidence would justify acting.
Organizational agreement matters as much as access to software. In Nielsen's 2025 global survey, 22% of marketers identified stakeholder alignment on key metrics as their leading measurement challenge. A shared definition of a qualified lead is therefore more useful than another unlabeled chart.
Give each review a different job
Use a 15-minute weekly check as a suggested operating habit, not a full strategy meeting. Review traffic, conversions, and obvious failures such as broken forms or missing data. Urgent technical problems shouldn't wait for the monthly meeting.
At the monthly review, compare each KPI with its target and choose a specific response. At the quarterly reset, decide whether metrics still reflect your priorities or should be added, retired, or redefined.
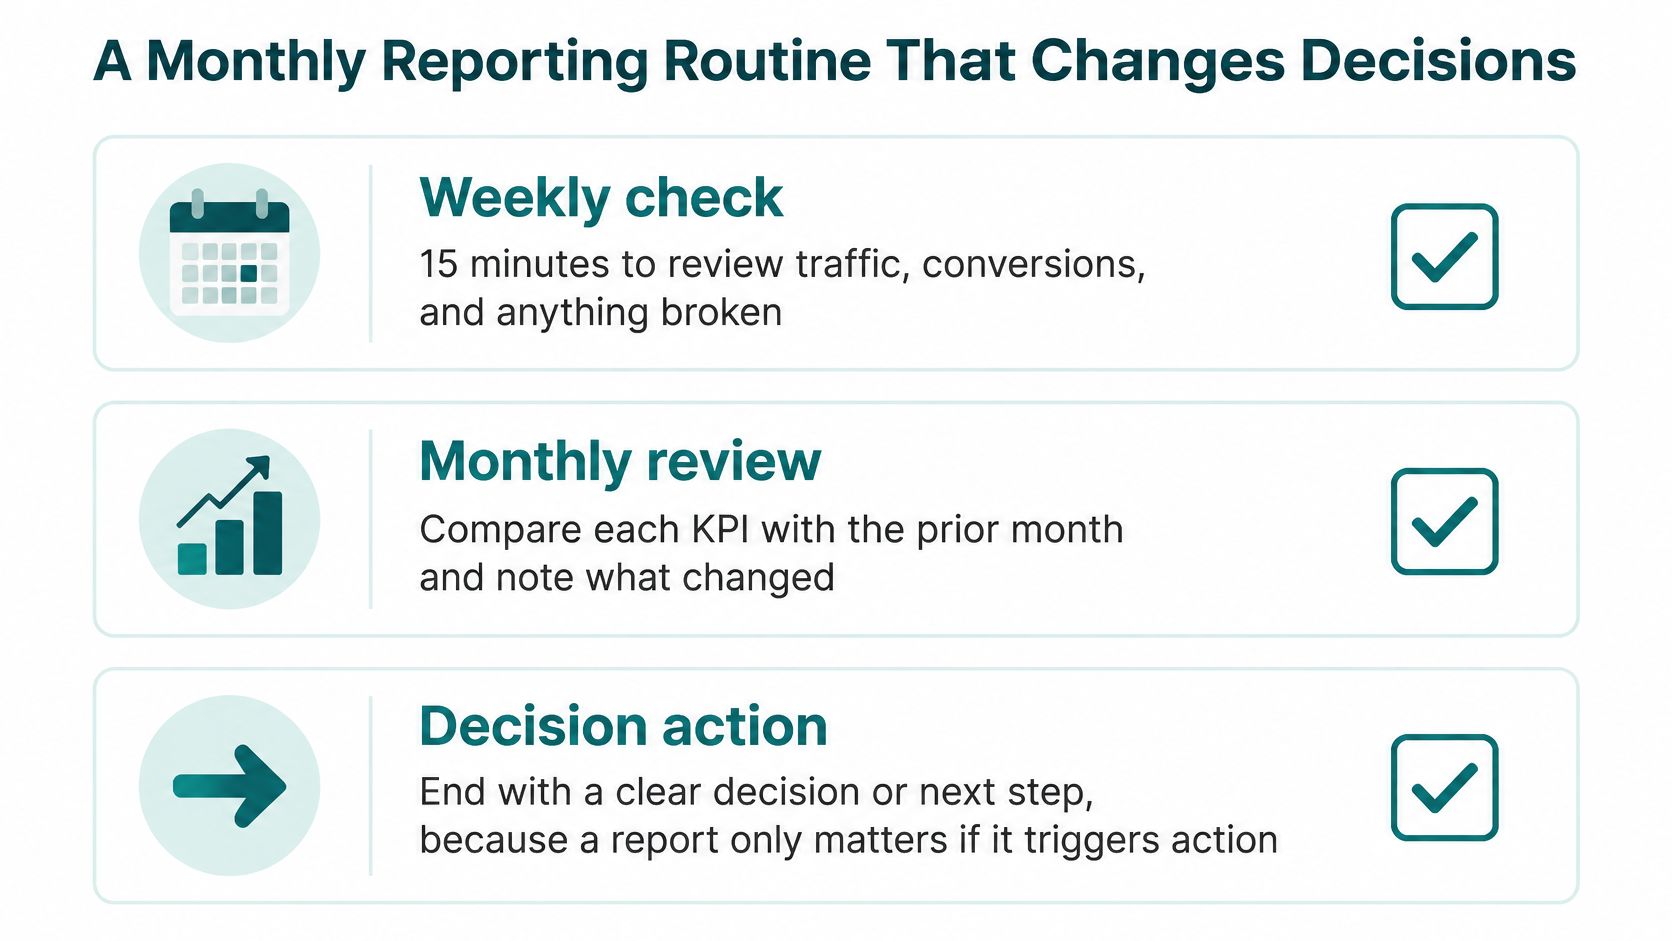
Write action triggers before results arrive. For a hypothetical internal rule, if cost per qualified lead rises 20% for two consecutive months, investigate lead quality and tracking, then pause the weakest ad group and test a revised offer if the evidence supports it. That's a proposed management threshold, not an industry benchmark.
Similarly, if the contact page's performance changes from good to poor, identify and repair the weakest element before sending more campaign traffic there. Use data visualization best practices to make targets, exceptions, and next actions readable.
Work through the monthly checklist
- Confirm ownership and definitions. Each KPI needs a named owner and an agreed meaning, including what makes an inquiry qualified.
- Compare results with targets. Note which action triggers fired and whether missing data affects interpretation.
- Choose a change and record a hypothesis. Explain why you believe the KPI moved and what intervention you're testing.
- Review automated recommendations. For AI-generated insights, require the data window, confidence level, known limits, and human approval before acting.
- Schedule follow-through. Put the next weekly check and quarterly reset on the calendar.
Keep the monthly summary to what changed, why you think it changed, and what happens next. Revisit the explanation later rather than treating it as established fact.
If compiling search reports takes too much effort, Keyword Kick's discussion of an SEO reporting tool offers evaluation context. Choose reporting software for clarity and maintainability, not the number of charts it can produce.
Start Your Measurement Plan This Month
Write down the commercial outcome you most need to improve. Then use this suggested 30-day start plan to turn measurement into a manageable habit.
- Week 1: Use the setup procedure to define the outcome, whether that's a booked consultation or completed order.
- Week 2: Test real forms and phone taps, and confirm the Search Console connection.
- Week 3: Choose three KPIs from the metrics table, assign owners, and book a 30-minute monthly review.
- Week 4: Decide what you'll maintain internally and where you need implementation or reporting help.
You don't need to become an analyst to supervise this work. If time is tight, ask a Cincinnati-area partner to audit tracking, configure key events, and connect lead records with revenue.
Ask any provider which KPIs they'll report, how each connects to revenue, and how you'll access the data. A simple, accurate measurement plan beats a complicated one that nobody checks.
Helbling Digital Media offers tracking audits, key-event setup, and reporting views that connect website activity with leads and revenue. Visit Helbling Digital Media to discuss your current website, SEO, or advertising measurement and identify what needs to be verified before your next campaign.