


You paid for traffic, the phone rings less than you expected, and someone on your team suggests a redesign. That is the moment most Cincinnati small and mid-sized businesses get how to improve customer experience backwards. A new look can help, but it won't fix a slow reply, a confusing checkout, or a form that asks for too much too soon.
Treat customer experience as operations you can measure. Where do people hesitate, quit, call for help, or lose confidence in you? Fix those moments in order, prove the change worked, and then decide what deserves a bigger investment.
Audit Your Customer Experience Before Changing Anything
Say a company launches a polished new site. The homepage looks sharp, yet the contact form has nine fields and nobody answers submissions for a day. Traffic arrives, interest fades, and the owner blames marketing when the actual problem sits after the click.
Start with the moments customers encounter, not the pages you are most proud of. I would spend one afternoon checking six touchpoints before approving any design work, because owners often guess wrong about where trouble starts.
What to Check at Each Touchpoint
Use tools you probably already have. Pull page exits and form starts from website analytics, count status questions in phone notes, check ticket dates in your inbox or help desk, and look at abandoned carts in your payment or booking system. Note the date range so later comparisons stay fair.
| Touchpoint | What to Check | Sign of Trouble | Quick Test |
|---|---|---|---|
| First website visit | Clear offer above the fold | High bounce from the homepage | Ask five people to say what you do within 10 seconds |
| Contact and quote requests | Form length and reply time | Forms started but not finished | Submit a test request and time the reply |
| Checkout or booking | Total cost and required fields | Carts or bookings abandoned | Buy or book once on a phone |
| Support and complaints | Time to first answer | Repeat contacts about the same issue | Track resolution time for 20 recent tickets |
| Follow-up after purchase | Order status and next steps | Calls asking where an order is | Count status-related calls for one month |
| Accessibility | Keyboard use, labels and contrast | Visitors who cannot finish forms | Navigate your top three pages using only the keyboard |
For each row, write down one number and one observation. A number tells you how often it happens, and an observation tells you what the customer saw. If you do not have a source for a number yet, write the question it would answer and start recording it this week.
Why One Score Hides the Problem
A single satisfaction score can look fine while one touchpoint fails badly. Happy repeat buyers may rate you well even as first time visitors cannot finish a quote form, so the average hides the leak. That is why you need the data trail behind the score, such as which pages lose visitors and how long complaints take to close.
Closing the loop matters as much as collecting comments, which is why the feedback-loop lessons from Bragly are useful when you decide who follows up and how fast. Assign every complaint pattern to a person, not a department mailbox.
Mark each touchpoint working, shaky, or broken. Do not soften a broken one because fixing it feels inconvenient.
Finish with a scored checklist, not a pile of opinions. Your audit should end with a clear, prioritized fix list that you get before deciding what to build or improve, with broken items at the top. If we run that audit for you, that is exactly the output, a prioritized fix list before any build commitment.
How to Map the Journey and Rank the Fixes
A journey map turns scattered complaints into one shared picture. It is not artwork for a wall. It's a working document that shows where a customer tries to do something, where your team hands them off, and where that handoff breaks.
The short process below gives you the sequence before the details.
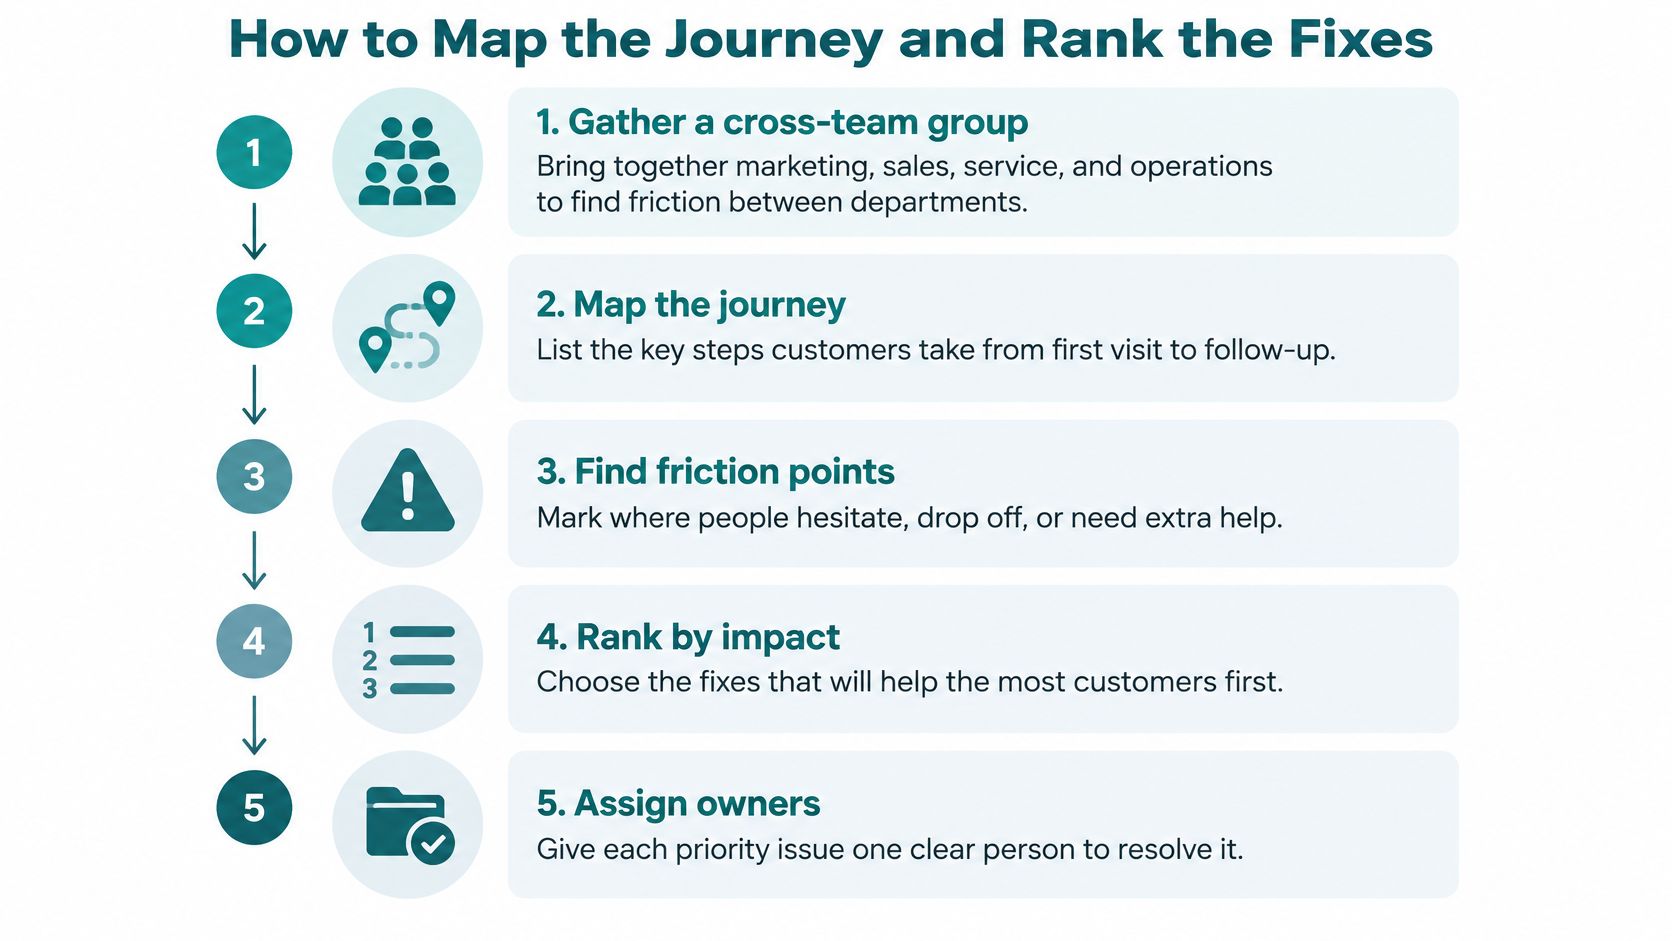
Six Steps That Produce a Ranked List
-
Gather two to four people across teams. Bring marketing, sales, service, and operations into one room because friction usually sits between departments. The common slip is letting one person draw the journey from memory.
-
Combine evidence before you draw. Put analytics, support tickets, and five short customer interviews side by side. If your team has never watched a real person use the site, our guide to what user testing involves shows a practical way to gather that evidence.
-
Map one task, not everything. Pick booking a consultation, checking out, or requesting a quote, and show the customer goal, feelings, each handoff, and each failure point. Mapping every possible path in one session produces a diagram nobody can act on.
-
Rank by impact, frequency, revenue, and effort. A rare annoyance should not beat a daily problem that blocks paid orders. Score each issue, argue about the scores, and write down why the top items won.
-
Give the top five problems an owner and a metric. One person owns the fix, and one number proves whether it worked, such as form completion or time to resolution. Shared ownership usually means no ownership.
-
Test against your baseline after 30 days. Compare the same task and the same customer segment before and after the change. Declaring victory after a busy weekend proves nothing.
In Nielsen Norman Group's study of 259 practitioners, 64% created their most recent journey map collaboratively, and teams found the work strongest for educating stakeholders about pain points and creating alignment, but weakest at persuading management to make internal optimizations. That gap is the trap. A map can create agreement without creating change.
Where to Start
Get an executive sponsor to approve remediation before mapping begins, even if that sponsor is you wearing a different hat. Without someone who can approve staff time or a process change, your ranked list will stall at good intentions.
Healthcare intake, legal consultation requests, e-commerce checkout, and software onboarding are strong first candidates because each has clear handoffs and measurable drop-off. For follow-up tasks in your map, it can also help to see how other retailers drive repeat purchases through SMS, provided customers asked for those messages. Your deliverable is simple, a one-page map and a ranked top five list your team can work from immediately.
Measure Experience With Metrics That Matter
You don't need twenty dashboards. You need four to six measures that combine what customers say with what they do, recorded before you change anything. Without a baseline, every later argument becomes a matter of taste.
The overview below groups the core measures many teams track.
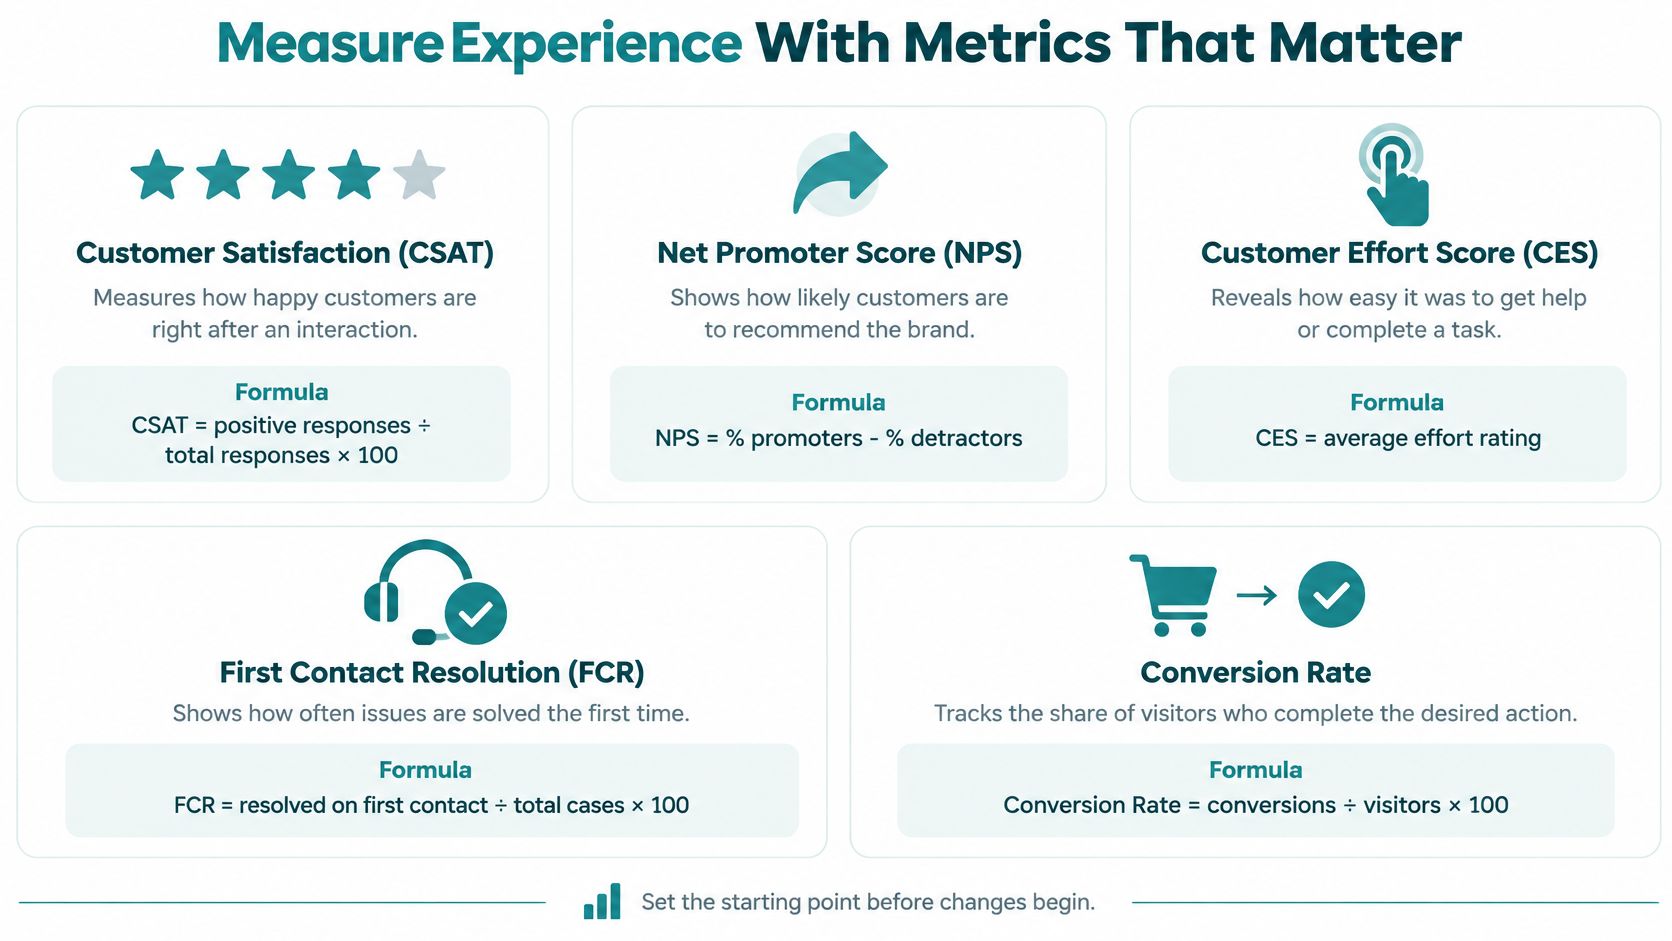
Build a Small Scorecard
Ask one question right after a task is finished, such as how easy it was to accomplish the goal, on a consistent five or seven point scale. That timing matters, because a survey sent a week later measures memory more than effort. Keep the wording identical so scores stay comparable.
| Metric | How to Calculate | What It Reveals | Review Cadence |
|---|---|---|---|
| Customer effort rating | Average rating after a task on a 1 to 7 scale | How hard the task felt | After each fix |
| Checkout abandonment rate | Abandoned checkouts divided by started checkouts | Where buyers quit | Weekly |
| First-contact resolution | Issues solved on the first contact divided by all issues | Whether support solves problems once | Monthly |
| Repeat purchase rate | Customers who buy again within a set period divided by all customers | Loyalty after the first order | Quarterly |
| Complaint resolution time | Average hours from complaint to resolution | Speed of recovery after a problem | Weekly |
| Trust rating | Average score on a survey question about confidence in your business | Whether customers feel safe with you | Quarterly |
Most inputs already exist in your systems, from checkout starts to ticket dates. If you are choosing survey software, our roundup of customer feedback tools can help you match the tool to the job instead of buying features you won't use.
Effort deserves special attention because hard interactions damage loyalty. Research summarized by Customer Alliance on customer effort score reports that 96% of customers experiencing a high-effort interaction become more disloyal, compared with 9% after a low-effort interaction, while 94% of customers reporting low effort indicate likely repeat purchase. That is why a small reduction in hassle can matter more than a friendlier script.
Read the Numbers Without Fooling Yourself
Track every measure by channel and device. An overall average can hide severe friction for mobile shoppers, older customers, or people using assistive technology. Compare the same segment before and after each fix, and check that the change is large enough to be meaningful before you rewrite a workflow.
Watch for false wins. A faster chat reply that produces more repeat contacts is not an improvement. It's a quicker failure.
Keep a weekly dashboard with three numbers your team will review: checkout abandonment, complaint resolution time, and a post-task rating. Add the slower loyalty and trust measures quarterly so you can see whether easier tasks turn into customers who come back.
Fix Checkout, Speed and Accessibility Problems First
Checkout is where willing buyers leave, so start there before you debate colors or homepage copy. In Baymard's research on reducing cart abandonment, 40% of shoppers abandoned a checkout because of extra costs such as shipping, taxes, or fees, while 18% abandoned because they were forced to create an account and 20% because delivery was too slow. Those are solvable business decisions, not mysteries.
The contrast between a blocked buyer and a confident one is easy to see once you watch the steps side by side.
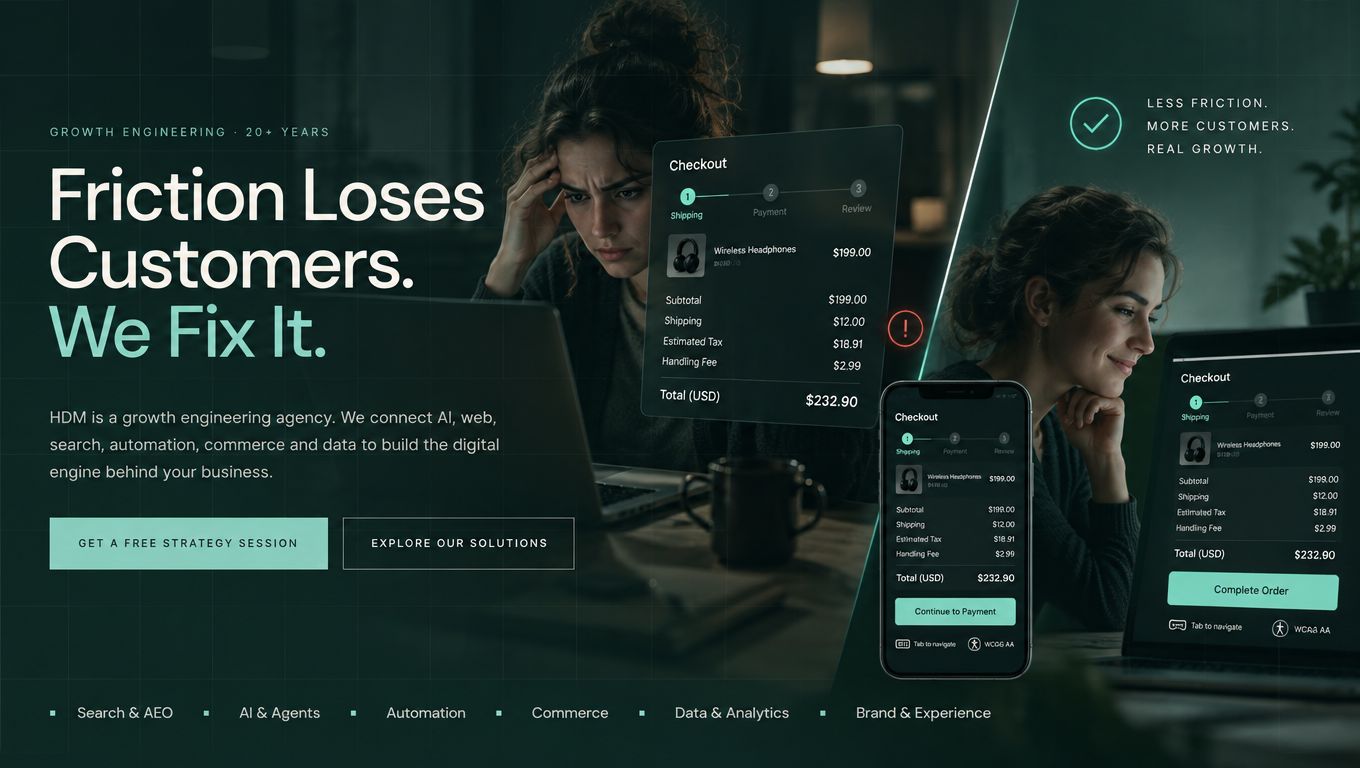
Make the Total Cost and Next Step Obvious
Show the total expected cost as early as practical and state delivery timing before payment. Offer guest checkout, explain why you need a phone number, and remove any field that does not help fulfill the order. For a Cincinnati retailer, clear pickup and delivery promises also stop avoidable calls after purchase.
Test one change at a time. Compare abandonment for two weeks before and two weeks after showing shipping estimates on the product page, and monitor account creation and payment step exits separately. Overall traffic won't tell you whether the fix worked, but step level exits will.
Speed and Accessibility Are Revenue Issues
Slow homepages, service pages, and contact forms cost leads before anyone reads your offer, especially on phones. Our work on core web vitals optimization focuses on the loading and stability issues visitors feel first. Compress oversized images, remove plugins you no longer use, and test your main form on a mid-range phone, not just office wifi.
The short video below is a useful prompt for walking through a page the way a first time visitor experiences it.
<iframe src="https://www.youtube.com/embed/CJHc_3tow0c" width="100%" height="400" frameborder="0" allowfullscreen></iframe>Accessibility fixes belong in the same first round because they block people from completing core tasks. In the UK government's 2022 to 2024 accessibility monitoring, the average test found 53 accessibility issues, with totals ranging from 14 to 116 issues. Start with revenue-critical pages, unlabeled form controls, weak contrast, missing keyboard focus, poor error messages, and missing image descriptions.
Healthcare sites should explain why sensitive details are needed and keep intake forms short. Law firms should use plain language intake questions that a stressed client can answer without guessing legal terms. Assign each fix this month an owner and a retest date, because an untested repair is only a hope.
Personalize and Automate Without Losing Trust
More automation is not always a better experience. Customers accept AI for routine work, but comfort drops when the stakes rise, so the fastest answer can be the wrong goal. I would automate less in high-stakes moments and protect trust instead.
Adobe's global survey of 4,000 customers found people are relatively comfortable with AI for routine customer service, recommendations, promotions, and other low-risk tasks, while comfort falls sharply when AI handles sensitive health or financial information or makes important decisions. That finding should shape your rules before you buy another chatbot.
Match Automation to Risk
| Interaction Type | Risk Level | AI Role | Human Checkpoint |
|---|---|---|---|
| Opening hours, order status and basic FAQs | Low | Answers directly | Hand off after two failed answers |
| Product suggestions and promotions | Low to moderate | Suggests, with an easy opt-out | Review recommendation rules monthly |
| Booking and appointment scheduling | Moderate | Books and sends confirmation | Staff confirm changes and cancellations |
| Returns, refunds and billing disputes | High | Gathers details only | A person decides every case |
| Health, legal or financial questions | High | Discloses AI use and routes the caller | Trained or licensed staff respond |
Disclose AI use in plain language at the start, not buried in terms. A short line such as, you're chatting with an automated assistant and can reach a person anytime, sets expectations. Keep that human route visible in every automated flow, because hiding it trains customers to distrust the tool.
Transparency is not just a legal layer. A Ping Identity 2026 global survey of 11,000 consumers across 12 countries found 56% considered knowing when AI was being used more important than receiving the fastest result, and only 12% fully trusted organizations to manage their identity data, down from 17% the previous year. Customers will often accept a slightly slower step when they understand what is happening to their information.
Personalize Only With Data Customers Expect
Use purchase history to suggest a refill or a relevant service, and say why the suggestion appeared. Do not use sensitive details from an intake form to target ads in a way that would surprise the person who shared them. Simple permission controls and an easy opt-out protect both conversion and credibility.
Healthcare and legal sites should never let a chatbot interpret symptoms or give case advice. Let it gather details, explain next steps, and route the person to trained staff, while returns and billing disputes also need a human decision. Review a sample of AI answers monthly for accuracy, consistency, and tone, and fix the source content when the bot repeats an outdated answer.
If a wrong answer would be costly, embarrassing, or hard to undo, a person approves it.
Measure successful resolution, repeat contacts, escalation quality, and trust, not chatbot containment alone. Containment only shows how many people stopped using chat, and some of them gave up. A slightly slower handoff that solves the problem once will usually beat an instant answer that creates a second contact.
Build Your 90-Day Customer Experience Plan
Ninety days is enough to find the worst friction, fix it, and prove whether customers noticed. It is not enough to rebuild everything, and trying to do so usually spreads your team too thin. Sequence the work so each phase earns the next one.
The roadmap below keeps the three phases distinct.
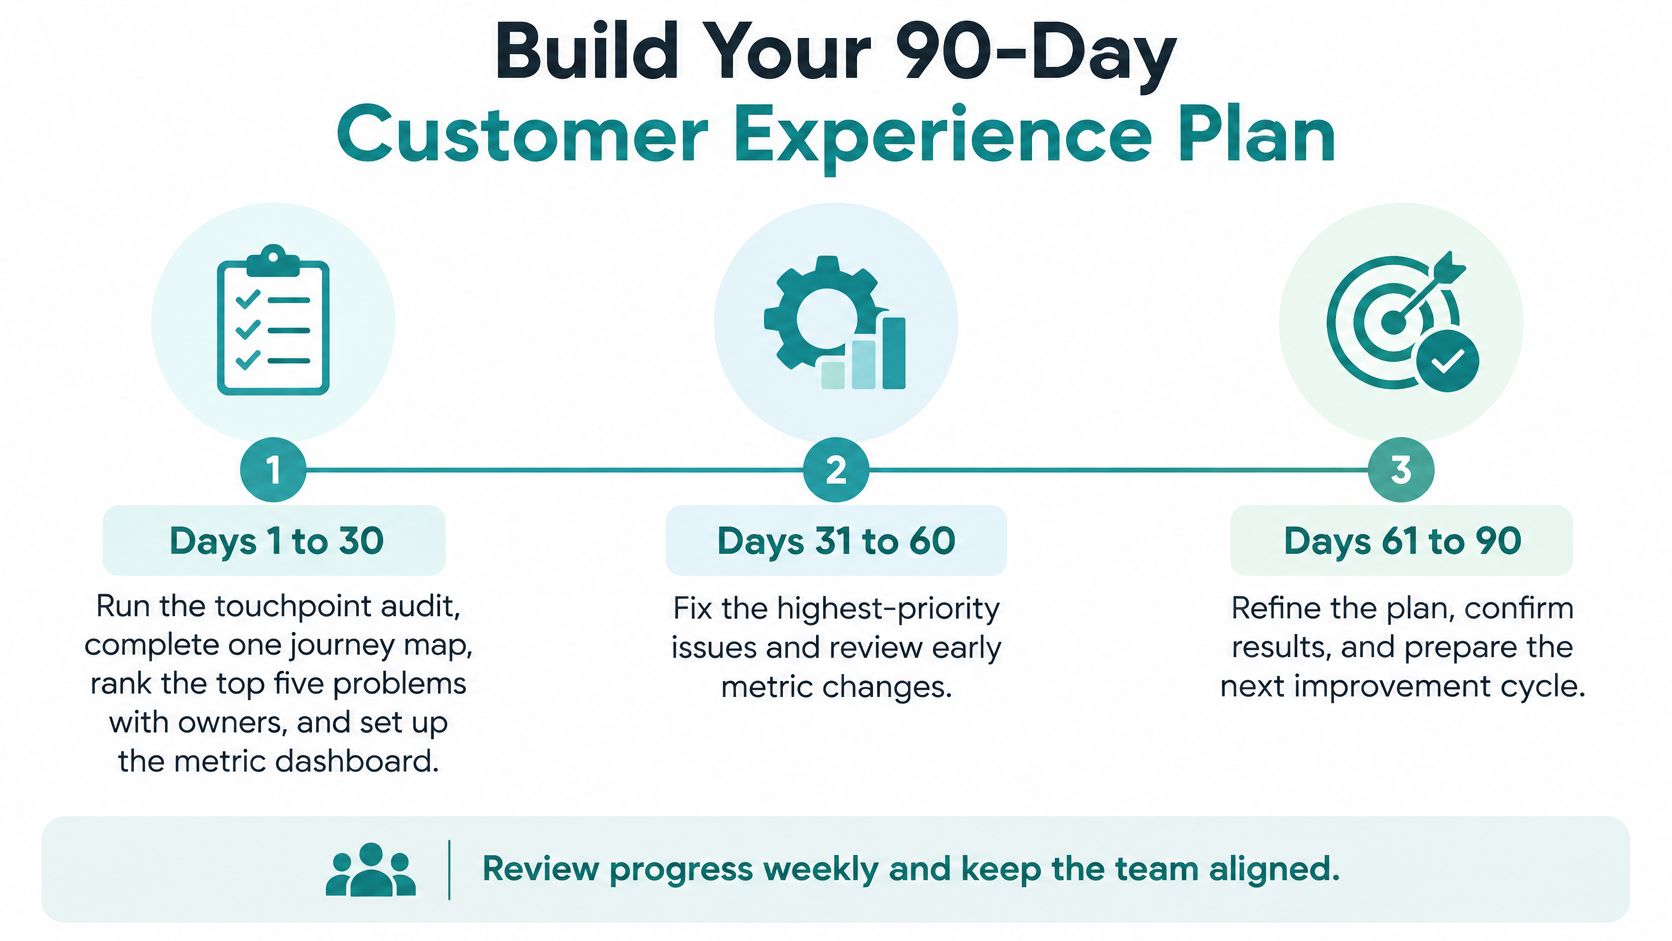
Days 1 to 30 Find and Rank
Run the touchpoint audit, complete one journey map, and rank the top five problems with named owners. Set up the small metric dashboard and record your baseline for the same tasks and segments you plan to remeasure. End the month with a written checkpoint that lists what you found, what you will fix first, and what you deliberately postponed.
Resist buying new tools during this phase unless a tool is the proven blocker. Most businesses already own enough data in analytics, inboxes, and booking systems to choose the first fixes.
Days 31 to 60 Fix the Expensive Problems
Work through the top checkout, speed, and accessibility issues, and review the weekly numbers as each change goes live. Keep changes small enough that you can tell which one moved the result. If a fix needs a process change behind the website, such as who answers quote requests, make that change in the same phase rather than hoping the new page compensates.
Do not wait for the quarterly survey to talk to customers. Ideas for proactive customer engagement beyond surveys can help you check in before small problems become complaints, as long as outreach stays relevant and easy to decline.
Days 61 to 90 Prove It and Choose the Next Round
Remeasure the same segments and retire fixes that did not move the numbers. Keep the winners, document what changed, and use the risk framework to decide whether any AI or personalization work is ready to expand. Your final checkpoint should state plainly what improved, what did not, and what the next top five will be.
If your internal audit uncovers more than your team can fix, Helbling Digital Media (HDM) can help you sort the work before you commit to a build. Clients can request a proposal and can book a free strategy call or send a message to start, and the company offers a free strategy session. You can contact us at hello@hdmcincy.com or (513) 668-7344, or visit hdmcincy.com.
Your action this week is smaller than a redesign. Put the touchpoint audit on your calendar for one afternoon, invite the people who handle handoffs, and leave with six touchpoints marked working, shaky, or broken.
If you want a measurable plan for how to improve customer experience without guessing where to spend first, Helbling Digital Media can audit your key touchpoints, rank the fixes, and help you improve the website and workflows behind them. Start with a free strategy session and a clear prioritized fix list by visiting Helbling Digital Media.