

A Shopify store can sit at a 1.4% average conversion rate while an exceptional store reaches 4.7%, meaning the difference between ordinary and elite performance is far more than a minor design adjustment. Littledata's benchmark, based on roughly 2,800 Shopify stores, places stores above 3.2% in the top 20% and stores above 4.7% in the top 10% (Littledata benchmark). Those figures make Shopify conversion rate optimization a business decision, not a cosmetic exercise.
For small and mid-sized businesses in Cincinnati, the practical question isn't whether your homepage looks modern. It's where qualified shoppers hesitate, whether mobile users can complete checkout comfortably, and whether traffic from newer discovery channels behaves differently from traditional search traffic. A careful CRO program connects those questions to measurable changes, realistic tests, and the economics of your store.
Understanding Shopify Conversion Benchmarks
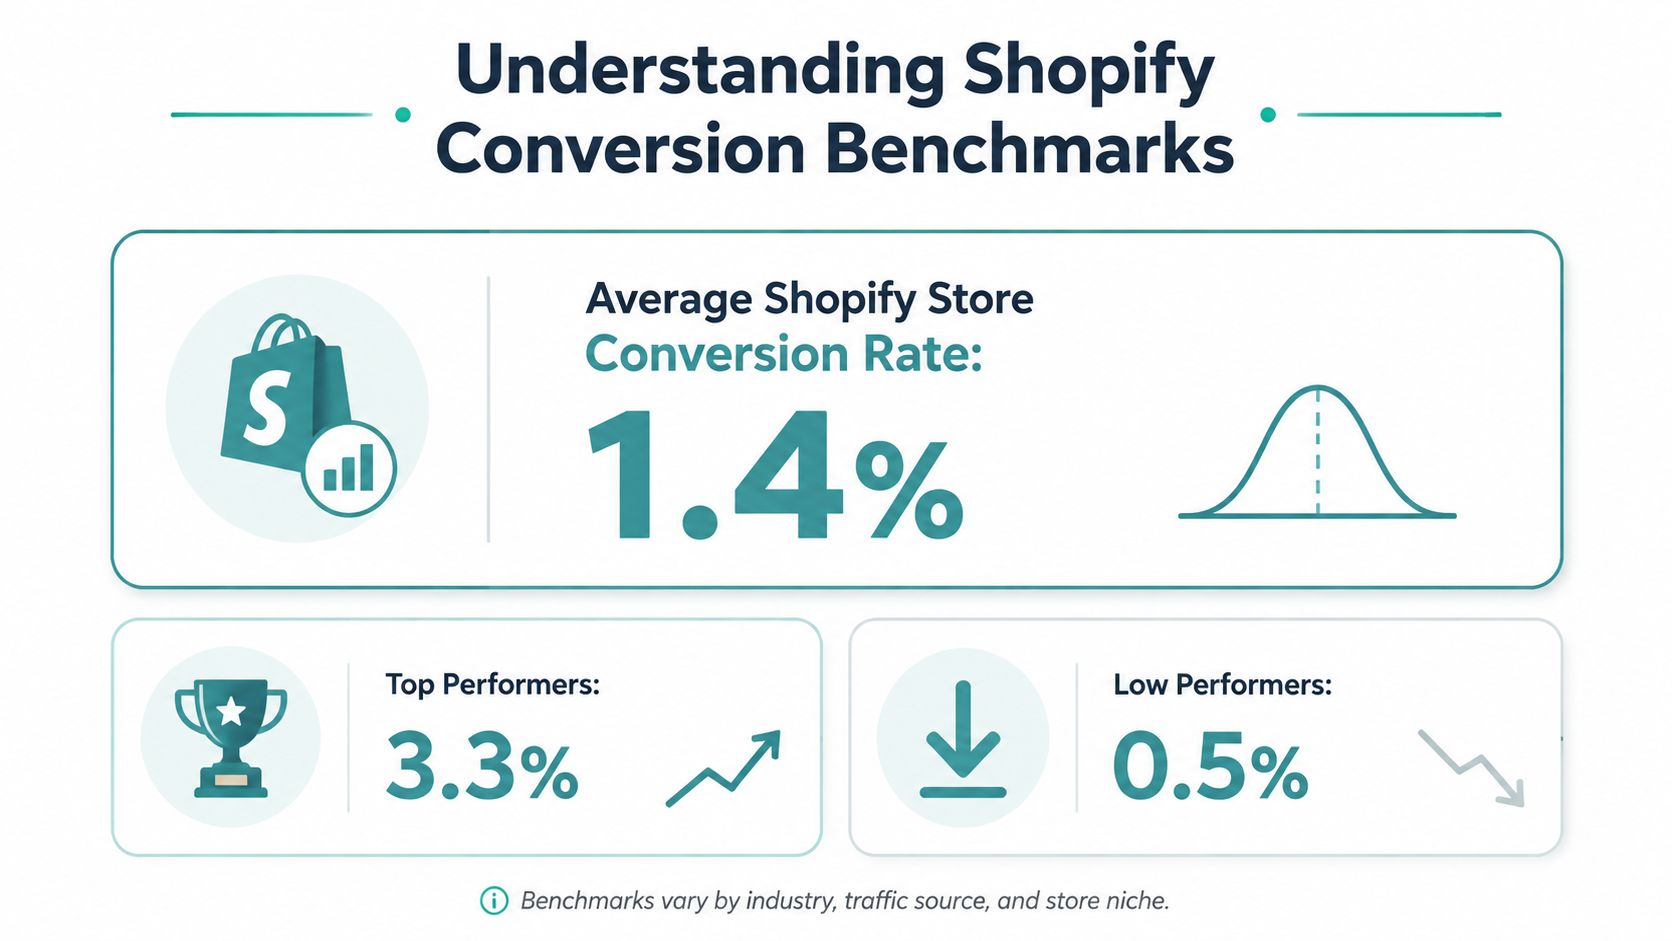
The 1.4% benchmark gives Shopify merchants a useful starting point, but it shouldn't become a universal target. A store selling considered purchases, serving a new audience, or attracting broad prospecting traffic may naturally convert differently from a store with strong repeat demand. Benchmarking tells you where to investigate. It doesn't explain why visitors leave.
A useful performance ladder is:
- 1.4%: The historical average in Littledata's Shopify benchmark.
- Above 3.2%: The top 20% of stores in that benchmark.
- Above 4.7%: The top 10%, or exceptional performance.
Shopify's own 2026 guidance also identifies stores converting above 3% as among the very best-converting online stores (Shopify's conversion guidance). The small difference between a 3% operating threshold and the 3.2% benchmark threshold shouldn't distract you. Together, they show that a store performing around or above 3% deserves a different CRO strategy from one still struggling near the platform average.
Calculate your rate consistently
Use one definition throughout your reporting. A straightforward formula is:
Conversion rate = completed purchases ÷ qualified sessions × 100
The important word is "qualified." Shopify Analytics and GA4 may use different session definitions, attribution windows, and filtering rules. Bot traffic can distort results, especially after unusual referral activity, so review suspicious sources before using a number to judge your marketing or design work. HDM's guide to bot traffic in Google Analytics provides useful context for separating automated activity from genuine shoppers.
Don't chase a benchmark without understanding your traffic mix. Compare device, source, landing page, new versus returning visitor behavior, and product category performance. A store owner in Cincinnati might discover that local branded searches convert well while national paid traffic lands on generic collection pages with little buying guidance.
Practical rule: Treat the benchmark as a diagnostic reference, not a promise of revenue.
To turn the rate into a business target, connect it to visitor volume and average order value using your own data. If traffic is limited, a modest improvement at a high-intent stage may matter more than a dramatic redesign of a low-traffic page. The best objective is a credible next improvement supported by evidence, not an arbitrary percentage copied from another merchant.
For additional practical ideas on how to convert browsers into buyers, focus on removing the specific uncertainty that prevents a shopper from moving forward.
Auditing Your Current Conversion Funnel
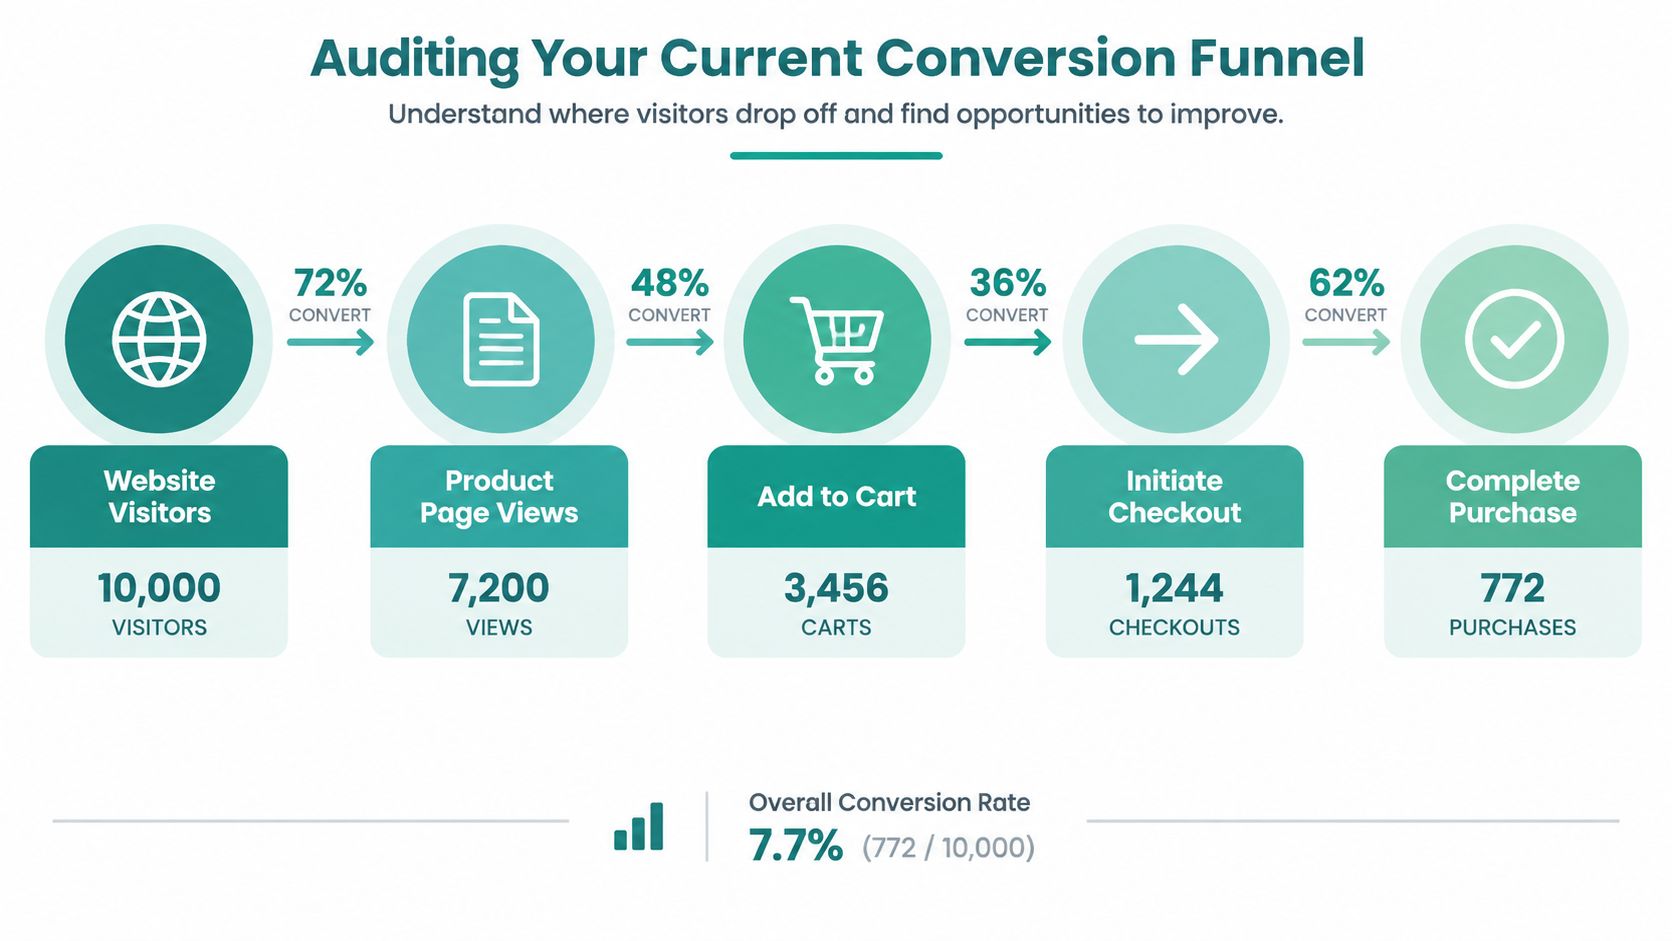
A storewide conversion rate hides the location of the problem. A proper audit follows the customer through a sequence of decisions, from arriving on the site to confirming payment.
Start by exporting or reviewing these events in Shopify Analytics and GA4:
- Landing session to product view. Do visitors understand what you sell and where to go next?
- Product view to add to cart. Does the product page answer questions about price, fit, delivery, quality, and returns?
- Add to cart to checkout start. Does the cart make the next step clear, or does it introduce unexpected costs?
- Checkout start to purchase. Are forms, payment methods, shipping choices, or trust concerns creating abandonment?
Find the largest commercially important leak
The biggest percentage drop isn't always the highest-value opportunity. A product page may lose many casual visitors, while a checkout issue affects fewer but highly motivated shoppers. Rank problems by a combination of traffic volume, purchase intent, order value, and ease of correction.
Use a simple audit worksheet:
| Funnel stage | Question to ask | Evidence to review |
|---|---|---|
| Product discovery | Can shoppers find a relevant product quickly? | Landing pages, search terms, collection engagement |
| Product evaluation | What objections remain unanswered? | Product page exits, review interaction, support questions |
| Cart | Are costs and policies clear? | Cart views, shipping messaging, quantity changes |
| Checkout | Where does completion stop? | Checkout events, payment selection, device segments |
Segment every stage by device type and traffic source. A paid social visitor may need more product education than a branded search visitor. A returning customer may respond immediately to an express payment option, while a first-time buyer needs visible shipping and return information.
Validate the data before redesigning
Check that events fire once, purchase values are recorded correctly, and internal traffic isn't inflating sessions. Compare Shopify's reporting with GA4 rather than assuming one platform is automatically right. If the numbers disagree, document the definitions before making decisions.
A data-backed sales funnel audit can help business owners structure this review without immediately purchasing an expensive analytics stack. For many SMB stores, a clean event map, a few device and source segments, and direct observation of the checkout flow reveal more than a crowded dashboard.
Write each finding as a testable statement: "Mobile visitors who reach shipping information are abandoning before payment," or "Visitors from non-branded search land on collections without enough product guidance." That wording turns a vague concern into a measurable hypothesis.
The Mobile vs Desktop Conversion Gap
One recent benchmark reports mobile conversion at 1.8% versus desktop conversion at 3.9%, a 116% difference (mobile and desktop Shopify CRO benchmark). The exact gap on your store may differ, but the operational lesson is clear. Mobile and desktop shoppers don't encounter the same experience, so they shouldn't receive the same optimization priorities.
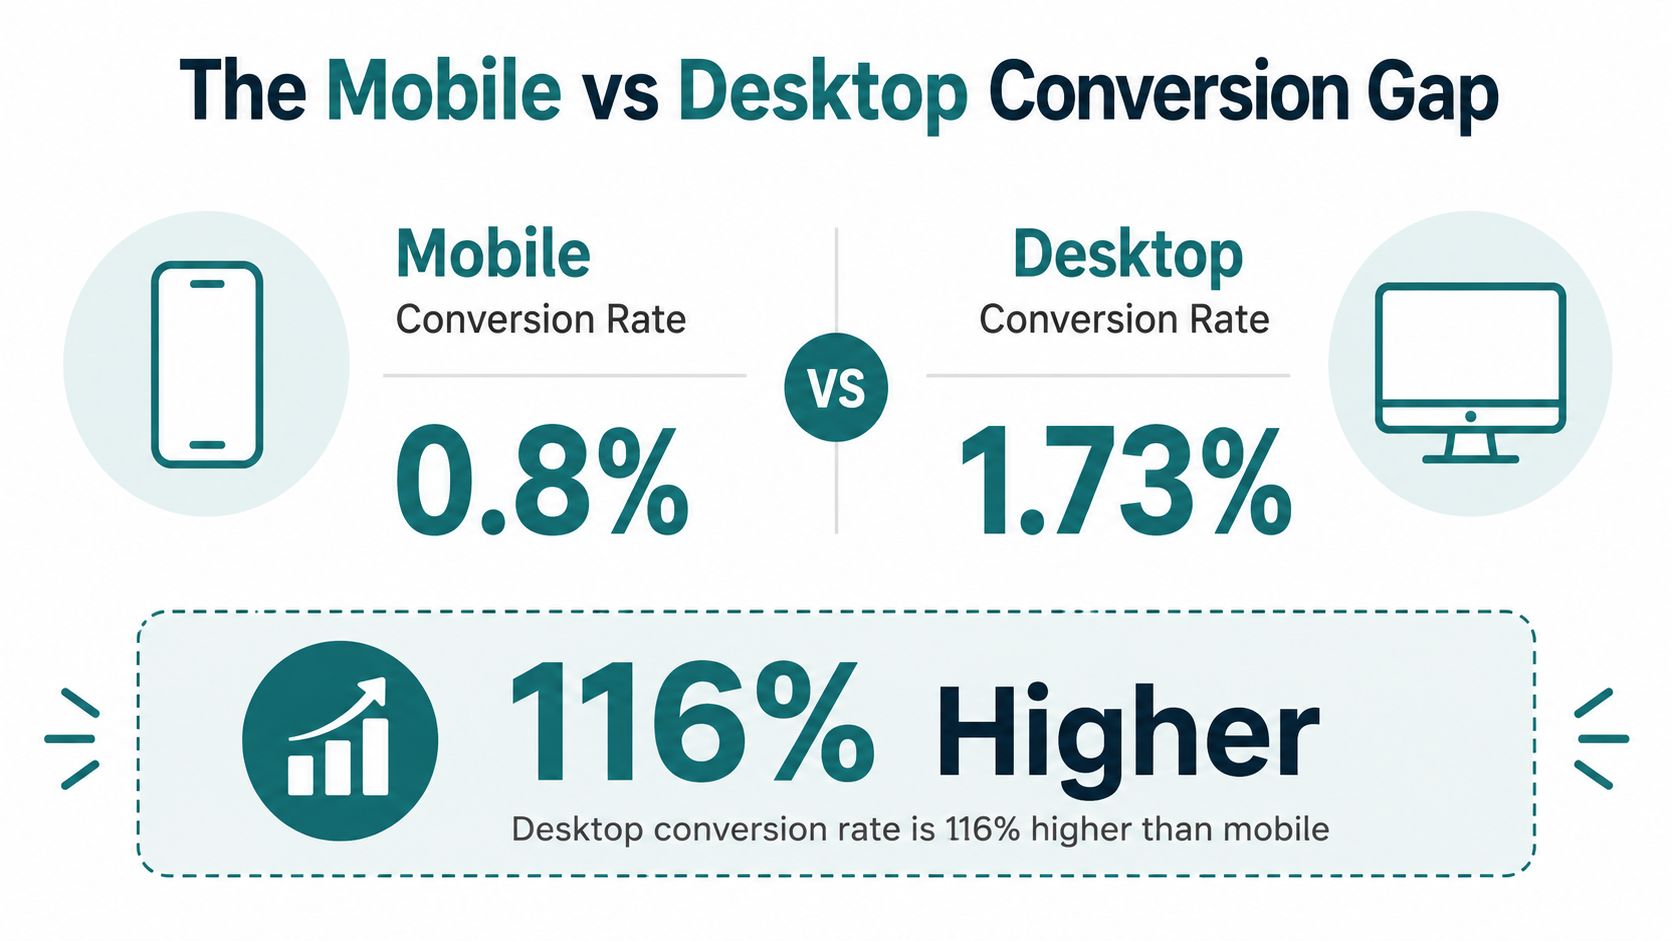
On desktop, shoppers have more screen space for comparison, navigation, product details, and form completion. On mobile, the same page may bury the price, push the primary CTA below distracting content, or force a customer to type information that a wallet could supply. Thumb reach, keyboard behavior, slow transitions, and accidental taps all shape the buying path.
Compare the experiences directly
| Area | Desktop priority | Mobile priority |
|---|---|---|
| Product page | Comparison details and image inspection | Price, benefit, CTA, delivery, and returns near the thumb zone |
| Navigation | Expanded categories and filters | Search, concise menus, and fewer competing choices |
| Cart | Cross-sells and detailed review | Clear total, shipping visibility, and an obvious checkout action |
| Checkout | Efficient form completion | Autofill, express payment, short forms, and minimal scrolling |
Audit mobile as a separate journey. Use a physical phone, not only a browser preview. Add an item, adjust the quantity, enter an address, select shipping, apply a discount, and complete payment. Note every moment that requires zooming, horizontal movement, repeated typing, or uncertainty about what happens next.
Express payment options deserve special attention because they reduce manual entry. Shopify's one-page checkout places cart contents, contact details, payment details, billing and shipping address, and shipping options on a single page (Shopify one-page checkout explanation). That changes checkout mechanics, but it doesn't automatically solve poor field ordering, unclear shipping information, or a CTA that's difficult to reach.
Keep mobile and desktop analysis separate in GA4 and in experiment reporting. A desktop winner may be neutral or harmful on a phone, particularly when a larger layout depends on hover states, side-by-side comparison, or dense navigation.
A responsive layout isn't automatically a mobile buying experience. Test the path with the same device your customers use.
For Cincinnati businesses serving local and national customers, device segmentation can also reveal whether shoppers arrive during work hours, from a service area, or through campaigns with different intent. Optimize the friction you can observe, not the friction a generic checklist assumes.
<iframe width="100%" style="aspect-ratio: 16 / 9;" src="https://www.youtube.com/embed/y7QvOcIi6ls" frameborder="0" allow="autoplay; encrypted-media" allowfullscreen></iframe>Building a Realistic Testing Framework
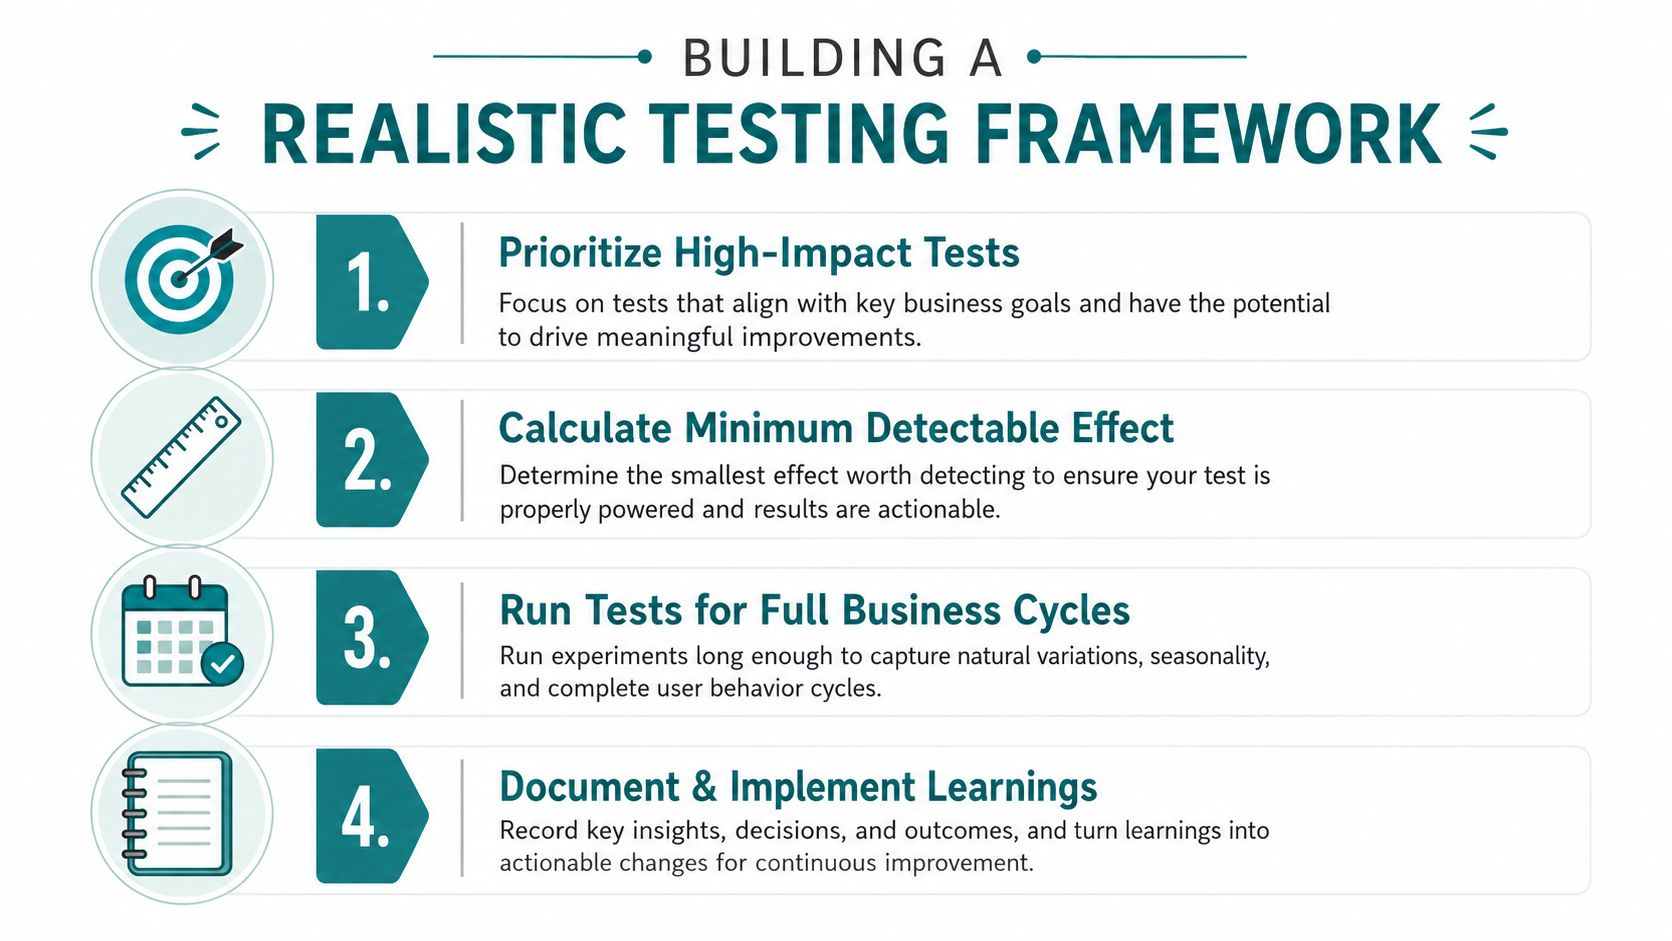
A/B testing becomes useful only when the decision process is defined before launch. Set a clear hypothesis, choose one primary metric, estimate the traffic required, and decide what result would justify a rollout.
Start by recording a 1 to 2 week baseline. Use the baseline conversion rate, minimum detectable effect, 80% power, and 95% significance to estimate sample size, following this ecommerce A/B testing framework. For stores with AI-driven or campaign-based traffic, record traffic source and device alongside conversion rate. A sudden mix of mobile visits or AI referrals can change results without any site change.
Build the backlog around the largest observable leak:
- Checkout clarity: Test shipping visibility or payment presentation when checkout abandonment is the largest commercial problem.
- Product confidence: Test benefit-led copy, review placement, or clearer returns information when product views are not becoming carts.
- Mobile completion: Test CTA placement, form order, or express payment emphasis on mobile when that segment shows distinct friction.
- Landing-page alignment: Test the message and product selection when a traffic source brings visitors to a page that does not match visitor intent.
Traffic volume determines how confidently you can call a winner. With a 2% baseline conversion rate, detecting a 10% relative lift, from 2.0% to 2.2%, may require roughly 38,000 visitors per variant, or 76,000 total (A/B testing sample-size guidance). A smaller store should not treat a short test as proof of a subtle improvement. This matters even more when AI-driven traffic arrives in uneven bursts or behaves differently from returning shoppers.
Decide what to do with limited traffic
If the store cannot support a clean A/B test, prioritize larger changes and combine several evidence sources:
- Review funnel, source, and device data.
- Watch session recordings or run moderated usability checks.
- Ask customer support which questions delay purchases.
- Make one controlled change.
- Compare the post-change period with the documented baseline, labeling the result directional rather than conclusive.
Test one major variable at a time. Run experiments for at least two full weeks when traffic permits, so weekday and weekend behavior are not mistaken for treatment effects. Keep mobile and desktop results separate, but avoid creating so many segments that each result becomes too small to interpret.
Skip multivariate testing until traffic and the business question justify examining interactions among several variables. For most Cincinnati SMB stores, a sequence of high-impact A/B tests, qualitative research, and before-and-after monitoring produces more useful decisions than an elaborate experimentation platform.
Page-Level Optimization Strategies
Product pages, collection pages, carts, and checkouts answer different customer questions. A shared template often adds clutter instead of helping shoppers decide. Optimize each page for the decision it must support, then evaluate its effect at the relevant funnel stage.
Product pages should resolve purchase anxiety
A shopper may still hesitate if delivery timing, sizing, or return terms are unclear. A brighter "Buy now" button will not resolve those concerns. Place the main benefit beside the product name, show useful image angles, position reviews near the decision point, and make shipping and returns easy to find.
Image quality matters, but oversized files can delay the first interaction. Before uploading a new gallery, find Shopify image size best practices, then inspect the page on a real phone. Choose images that help shoppers verify fit, scale, texture, or use, rather than images that only look attractive.
Collection pages should reduce search effort
A collection page should let shoppers narrow choices using buying criteria, not your internal catalog structure. Use descriptive filters, consistent product cards, and visible price and availability. For larger collections, sorting should reflect practical intent, such as price, newest arrival, or relevant product attributes, rather than only "featured."
Cart and checkout should remove surprises
A cart drawer can preserve momentum by showing the selected product, quantity controls, total cost, delivery expectations, and next action without unnecessary navigation. Place relevant cross-sells below the primary path. If an offer competes with checkout, it can reduce completion while increasing neither order value nor clarity.
Shopify's one-page checkout can keep the transaction on one screen, but surrounding information still affects confidence. Review the experience with Shopify's one-page checkout optimization guide, giving extra attention to mobile where limited screen space makes missing delivery or payment details harder to overlook.
Apply the testing process established earlier before changing several page elements at once. A product-page revision should be assessed through add-to-cart behavior, while a checkout revision should be judged through checkout completion and revenue per session. Keep mobile and desktop results separate when their traffic or conversion patterns differ, and treat small-store results as directional when volume is limited.
Do not declare success because time on page increased. More time can indicate engagement, but it can also signal confusion.
Optimizing for AI-Driven Traffic
Many merchants still group visitors from AI assistants with all organic search traffic. That assumption is becoming less useful. Recent benchmark guidance recommends tracking AI referral conversion separately in GA4 and examining whether visitors arriving from AI assistants land on pages that match their already-specific intent (AI and channel conversion benchmarks).
An AI-referred shopper may arrive after asking for a narrow product recommendation, comparison, or solution. The landing page needs to confirm that context quickly. Generic promotional copy can create a mismatch even when the product is relevant.
Build a separate measurement view
Create a channel grouping or exploration that isolates identifiable AI referrals where your analytics setup can capture them. Review:
- Landing page: Which product, collection, or guide receives the visit?
- Engagement path: Does the visitor move directly toward product evaluation?
- Conversion behavior: Does the session produce a purchase, add-to-cart, or checkout start?
- Attribution quality: Are referrals being classified as direct or organic because tracking information is missing?
Treat attribution carefully. AI traffic may pass through browsers, links, or assistant experiences that don't preserve a clean referral signal. The objective isn't to force every session into a new channel. It's to identify meaningful patterns without overstating certainty.
Product pages should state facts plainly, including materials, compatibility, dimensions, delivery terms, warranty details, and returns. That structure helps human shoppers scan the page and gives discovery systems clearer information to interpret. Don't write for machines at the expense of customers. Clear product data, consistent naming, and useful answers are the durable approach.
For Cincinnati owners exploring broader digital strategy, HDM's discussion of AI digital marketing trends offers useful context. AI-driven discovery isn't a replacement for onsite CRO. It changes the question from "Does this page convert everyone?" to "Does this page fulfill the intent that brought this visitor here?"
Measuring and Sustaining Conversion Lift
A conversion-rate increase matters only if it improves the business. Track the primary purchase conversion rate, but pair it with revenue per visitor, average order value, margin, and repeat purchase behavior where your data supports those calculations. A promotion can increase orders while weakening profitability, and a cross-sell can raise order value while reducing checkout completion.
Keep a test record with the hypothesis, audience, device scope, start and end dates, primary metric, secondary guardrails, implementation notes, and result. Mark outcomes as winner, loss, or inconclusive. An inconclusive test is useful when it prevents a team from treating noise as a permanent design decision.
A simple dashboard should answer four questions:
- Which traffic sources bring qualified shoppers?
- Where does each device segment leave the funnel?
- Which changes affected commercial outcomes?
- What should the team test or inspect next?
Recheck tracking after theme updates, app installations, payment changes, and campaign launches. A broken purchase event can make a successful store appear to have failed, while bot activity can distort acquisition and engagement reports. The bot traffic analysis guide is a practical reference when unexplained sessions appear in your reporting.
Shopify conversion rate optimization becomes sustainable when every change creates a documented learning loop. Measure the baseline, isolate the intervention, protect the data, and connect the result to profit rather than celebrating a dashboard metric in isolation.
HDM helps Cincinnati-area businesses improve Shopify storefronts through conversion optimization, analytics, mobile-first design, SEO, and custom development. Visit HDM to discuss a funnel audit and a practical growth plan built around your store's traffic, customers, and testing capacity.