


An average of 70.19% of online shopping carts are abandoned before a purchase completes, based on 49 different studies compiled in Baymard Institute's checkout usability research. Hold that next to any keyword ranking report and the gap in most search budgets becomes obvious. Getting found is half the job. The other half is what happens on the page after someone arrives.
Plenty of Cincinnati businesses buy search work and conversion work as two separate projects, from two separate vendors, reviewed in two separate meetings. That split is where the money leaks. A page can climb to position three and still lose nine out of ten visitors at the form. A site can load in under two seconds and still make people leave because the price isn't shown. This guide follows the whole chain, from a search result to a booked appointment or a paid order, and says plainly where each fix pays off and where it won't.
Set KPIs That Connect Search Traffic to Revenue
Most search reporting starts with a ranking, and that's the first mistake. In 2024, 58.5% of U.S. Google searches and 59.7% of EU Google searches ended without a click to any result, according to a clickstream study of U.S. and EU search behavior covering September 2022 through May 2024. For every 1,000 searches, only about 360 clicks in the U.S. and 374 in the EU reached the open web, and nearly 30% of U.S. clicks went to Google-owned properties such as YouTube, Google Images and Google Maps.
That's the field you're playing on. A page can rank well, hold a snippet, sit in the map pack, and still send almost nobody to your site. Organic search isn't finished, though. In 2024 it produced an average of 33% of total website traffic across seven industries, per Conductor's 2025 State of SEO report. It remains the biggest single channel for most small businesses, which is exactly why it deserves a scorecard that ends in dollars rather than in position.
The scorecard to build first
Five numbers tell you whether search is making money. Assemble them once a month, on one page, and stop arguing about rank.
| KPI | What It Tells You | Where to Find It |
|---|---|---|
| Impressions and clicks by query | Whether your pages appear and get chosen | Google Search Console |
| Click-through rate on high-impression pages | Whether your titles and snippets earn the click | Google Search Console |
| Conversion rate from organic landing pages | Whether visitors take the action you want | Google Analytics 4 |
| Revenue or qualified leads per organic session | How much money each visit is worth | Analytics combined with your CRM |
| Branded versus non-branded organic traffic | Whether you are building demand or only capturing existing demand | Search Console query filters |
Impressions show whether Google displays your pages at all. Click-through rate shows whether your title and snippet beat whatever else sits on that screen. Neither one pays an invoice, which is why the bottom two rows carry the most weight. Revenue per organic session is the only line that answers the question a business owner asks.
What a dental practice learned from a better KPI
Say a Cincinnati dental practice swaps its monthly "organic sessions" figure for "booked appointments per 100 organic visits." Month one looks healthy at 1,400 sessions. Month two, matched against the booking system, shows that a set of new whitening articles drew a third of the traffic and produced almost no appointments. One page about emergency dentures pulled 90 visits and filled 11 chairs.
That's a measurement failure, not a content failure, and it took two months to surface because the report counted visits. One page earned. The other page entertained.
Practical rule: If a number can't be traced to a call, a form, a booking or a paid order, it belongs in a diagnostic report, not the main one.
Record the baseline before you touch anything
Pull the last 90 days first. A full quarter covers seasonal swings and gives you a control period for later comparisons. Capture impressions, clicks, click-through rate, landing-page conversion rate, and leads or revenue per organic session, split by device.
If the labels in that table feel foreign, what marketing analytics actually covers walks through each one in plain language. When you're ready to build the dashboard itself, Wojo Media's performance marketing dashboard guide shows how to fold several data sources into one view that survives a Monday morning review.
Three actions this week. Pick one revenue-linked goal, whether that's booked appointments, quote requests or completed orders. Choose three KPIs from the table above. Put a recurring monthly review on the calendar with a person's name next to it.
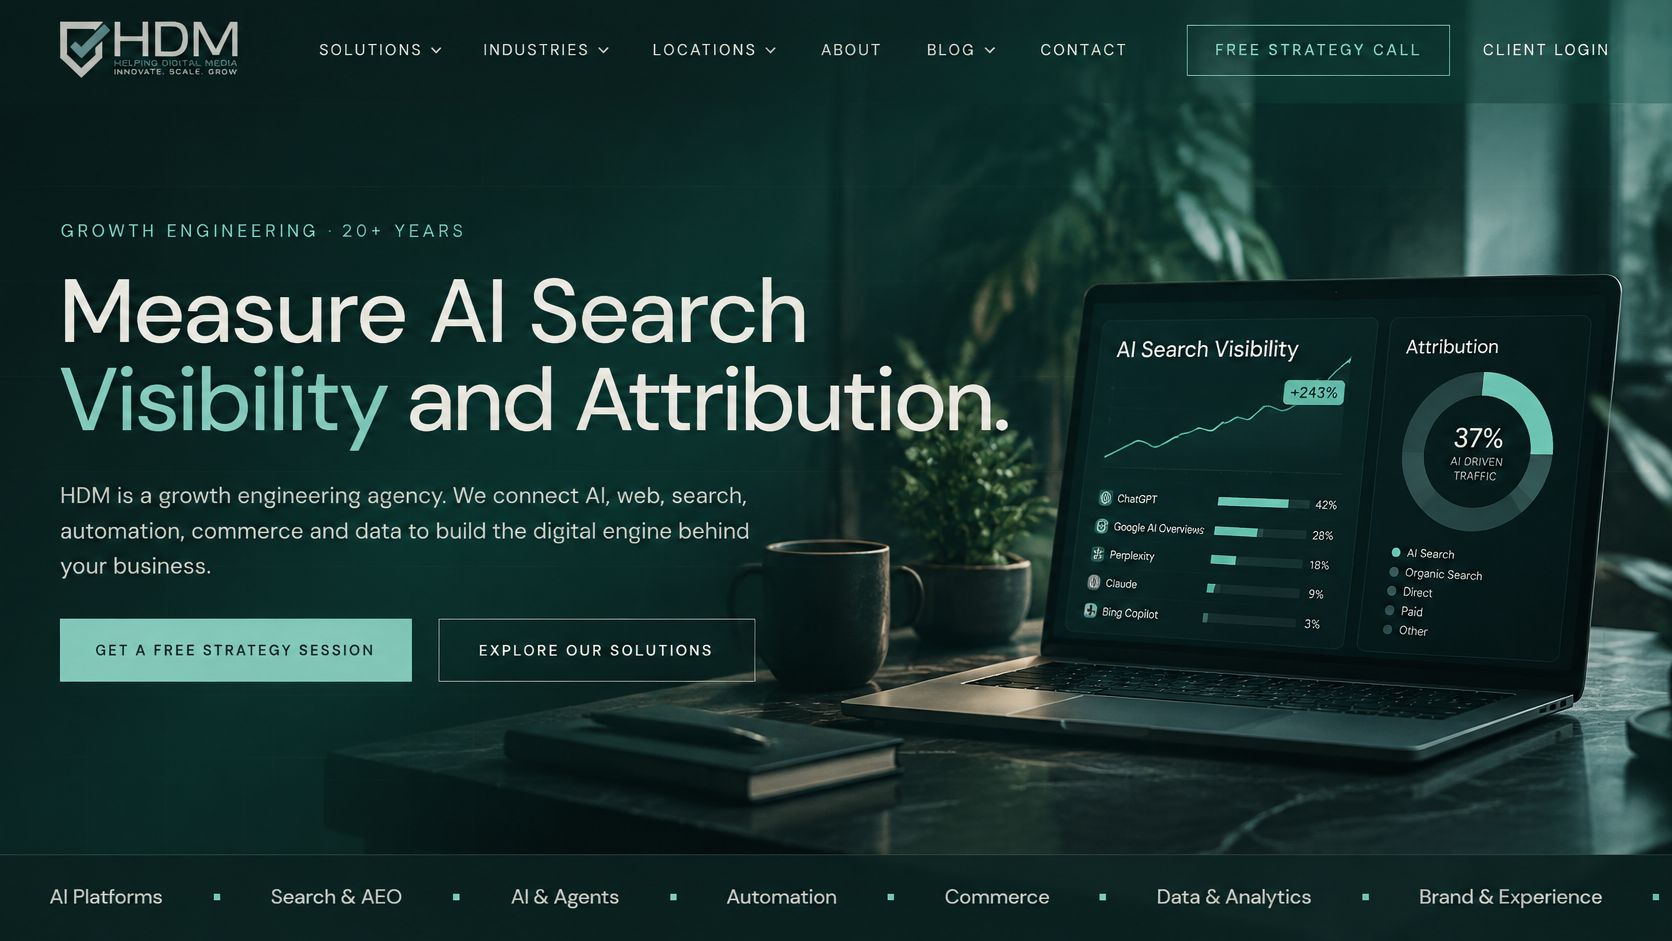
Measure AI Search Visibility and Attribution
Google increasingly answers the question before anyone scrolls. Pew Research Center analyzed browsing activity from 900 U.S. adults and found that users clicked a traditional result in only 8% of visits when an AI summary appeared, compared with 15% when it did not, as reported in Pew's study of AI summaries in search results. Clicks on a link inside the summary happened in just 1% of visits, and people ended their session on 26% of AI-summary pages versus 16% of ordinary results pages.
Being named inside an AI answer can still win you the job. A buyer asks which personal injury attorney to call in Cincinnati, reads a summary naming three firms, and phones one of them an hour later from a different device. No session, no click, nothing in your analytics. Your rank for that query tells you nothing about the call.
Where influenced demand shows up
Four places, none perfect on its own, form a usable picture together.
- Branded search volume in Search Console. Filter queries down to your business name and common misspellings. A steady climb while non-branded clicks stay flat is the fingerprint of visibility without visits.
- Direct traffic. Noisy, because bookmarks and app traffic mix in, but a step change after a new AI feature appears is worth investigating.
- A unique tracked phone number. Use a number on the site and in your Google Business Profile that appears nowhere else, so every call from it gets logged against search.
- A required "How did you hear about us?" field. Free text beats a dropdown, because dropdowns only offer the options you already thought of.
Then connect the answer to the outcome. When a lead writes "found you on Google" and Search Console shows no click for that day, tag the record as search-influenced in your CRM. Over a quarter, the pattern either holds or it doesn't, and you'll know which within one review cycle.
A Cincinnati law firm can watch this play out. Branded searches climb, calls climb, and organic clicks stay flat. The intake notes do the rest: clients describe comparing firms through an AI summary before ever visiting a website. Nothing is broken. The measurement was pointed at the wrong number.
What to invest in when clicks fall
Put budget into pages that finish a job an AI summary can't finish on its own: current pricing with real ranges, a booking calendar, proof of experience with named matters and dates, availability for a specific location. A summary can describe your service. It can't schedule a Tuesday appointment or answer a question about a specific property.
That's why the monthly report should rank success by qualified leads. Visibility and raw traffic can move in opposite directions for a year at a time. If you want to know whether your business is the answer when someone asks ChatGPT, Google AI Overviews, Perplexity or Gemini who to hire, Helbling Digital Media runs a free AI visibility check on exactly that question. For teams comparing monitoring tools, this comparison of answer engine optimization platforms covers what each one captures.
How to Run a Combined SEO and CRO Audit
Search audits and conversion audits usually happen in separate rooms. One person checks titles, indexing and internal links. Someone else reviews forms and checkout screens. Pages that rank decently and convert badly slip between the two, because neither report owns them.
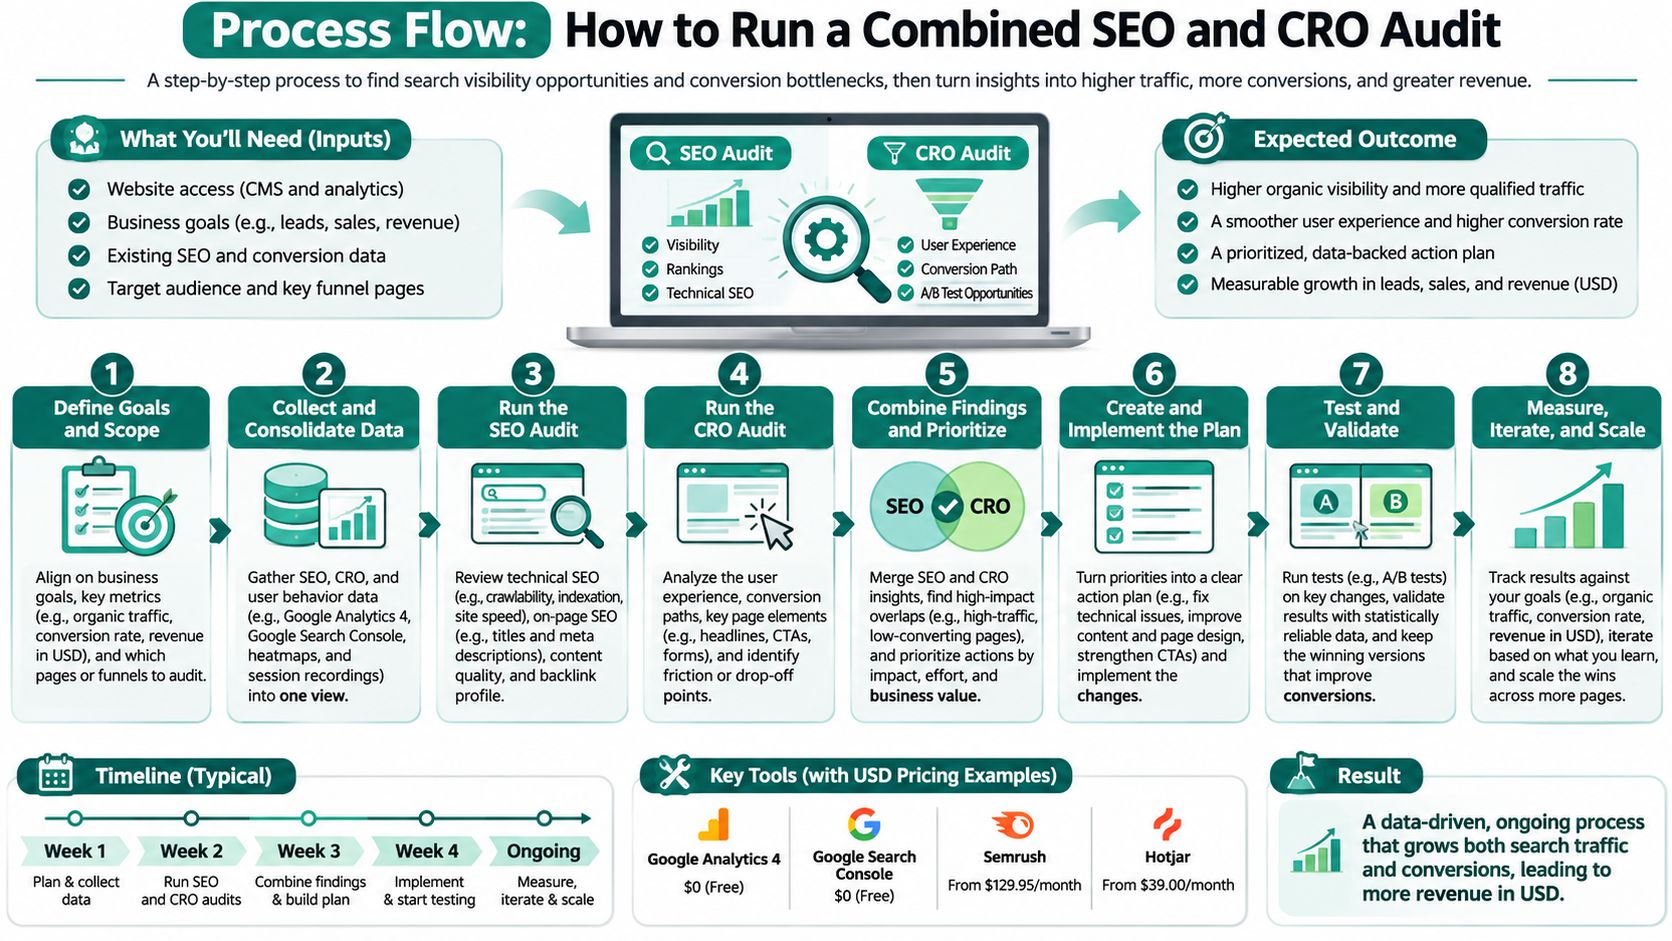
The fix is one audit with six passes. Each pass answers a question the others can't.
- Export 90 days of clicks, impressions and click-through rate by page from Search Console. Reason: this shows the pages Google already displays, so you're prioritizing real opportunity rather than guesses about which keywords might matter.
- List your top 20 organic landing pages and label the intent behind each one's main queries. Reason: someone learning, someone comparing and someone ready to buy need different pages. A page that ranks on a comparison query but reads like a brochure will rank and convert poorly.
- Pull conversion rate and form or checkout completion by page and by device. Reason: site-wide averages hide mobile failures. A page converting at 4% on desktop and 0.4% on mobile isn't a 2% page; it's a broken page diluting into a passing grade.
- Flag three groups. High impressions with weak click-through rate, strong traffic with poor conversion, and valuable queries whose landing page never answers the question. Reason: each group needs a different fix, and mixing them wastes the next month.
- Open every flagged page on a phone and check four things. Reason: that's how most local searches end. Does the main content appear quickly, does the headline match the search, is the call to action visible without scrolling, and how many form fields stand between a visitor and the action.
- Record every finding in one shared sheet with an owner, a date and the expected effect. Reason: an audit that lives in a PDF gets admired once and forgotten. A sheet with names on it gets worked.
The test for a real finding is simple. You can name the page, the problem and the change in a single sentence.
What a finished audit looks like: a short list of flagged pages, each with one reason it's on the list and one planned change. If the list runs past a dozen items, cut it. A dozen pages fixed properly beats sixty pages noted. Give each change its own row, its own date, and its own expected effect, even if that expectation is just direction and rough size. You'll need it when you compare results later and try to remember why anyone thought this was worth doing.
Fix Speed and Technical Problems in the Right Order
Google scores every page on three experience measures, and those scores matter for search and for whether a visitor stays long enough to act. Google's Core Web Vitals documentation sets the three thresholds, and Google says the metrics feed its ranking systems.
| Metric | Target | What It Measures |
|---|---|---|
| Largest Contentful Paint (LCP) | 2.5 seconds or less | How quickly the main content appears |
| Interaction to Next Paint (INP) | Under 200 milliseconds | How quickly the page responds after a tap or click |
| Cumulative Layout Shift (CLS) | Below 0.1 | How much elements move unexpectedly while loading |
Read them as customer experience rather than as test scores. LCP is the wait before someone sees your headline. INP is whether the button responds when they tap it. CLS is whether they tap the wrong thing because the layout jumped while a form loaded over their thumb.
Fix high-intent templates first, not the whole site
Engineering time is limited, so spend it where the money is. Quote-request pages, service pages, product detail pages, appointment flows and checkout steps come before the homepage and long before blog templates. A quarter-second saved on a page nobody converts on is a rounding error.
Mobile needs its own pass, because that's where local leads come from. A 2025 measurement cited in this analysis of page speed and conversion found that 48% of origins passed Core Web Vitals on mobile compared with 56% on desktop, so phone visitors are getting the weaker experience on most of the web.
Three fixes that repay the effort most often:
- Compress the oversized hero image. A photo straight from a camera at 4,000 pixels wide, displayed at 1,600, wastes bandwidth on every visit. Resize to display width, export at reasonable quality, and expect a file under 200KB.
- Remove unused third-party scripts. Old chat widgets, heat-map trackers and retired ad pixels all delay the first tap. If nobody has logged into the tool in six months, delete the snippet.
- Reserve space for embedded forms. Give a booking form a fixed height before it loads, so the page doesn't push content around while the visitor is typing.
Speed affects revenue, not just rankings. A Google study of 37 retail, travel, luxury and lead-generation brands across Europe and the United States associated a 0.1-second improvement in mobile load time with an average 8% increase in retail conversions and 10% in travel conversions. It's an association, not a guarantee for a plumbing company in Anderson Township, but it's enough reason to treat speed as conversion work. For the technical detail behind each metric, this guide to Core Web Vitals optimization covers measurement and field data.
When speed work won't pay off
If your offer is vague, your proof is missing, or your only contact route is a form buried at the bottom, a faster page just delivers people to the same dead end quicker. Check those three things before funding performance work. Healthcare and legal sites have an extra constraint, since accessibility, privacy and form usability can matter more than shaving a few hundred milliseconds off a lab test.
Rule of thumb: One template per month. Measure completed leads for two to four weeks. Only then move to the next template.
Remove Checkout and Form Friction That Costs Leads
The reasons people abandon a purchase are specific and fixable. Baymard Institute's research on U.S. online shoppers, excluding people who said they were only browsing or weren't ready to buy, ranks them like this.
| Abandonment Reason | Share of Shoppers | Practical Fix |
|---|---|---|
| Extra costs such as shipping, taxes or fees | 40% | Show total cost on the product page and at the start of the cart |
| Delivery that is too slow | 20% | State realistic delivery timing before checkout |
| Distrust of the site with card information | 19% | Place payment security cues next to card fields |
| Required account creation | 18% | Offer guest checkout as the default option |
| Checkout too long or complicated | 17% | Remove unnecessary fields, cutting 20 to 60 percent where possible |
Start at the top, because extra costs is the single largest reason and the cheapest to fix. Show shipping and estimated tax on the product page, or at the top of the cart, so nobody discovers a surprise at the payment step. Hiding costs until the last screen doesn't protect your conversion rate. It converts a nearly finished buyer into a person who feels tricked.
Delivery timing comes next. "Ships in 2 business days" beats "fast shipping" every time, because one is information and the other is noise. On the trust problem, put card security cues beside the card fields rather than in a footer badge nobody scrolls to.
Cut fields, and let people buy without an account
Guest checkout should be the default, with account creation offered after the order completes. Forcing a registration before purchase is one of the most common and most expensive design decisions in small e-commerce.
Then cut the form itself. Baymard reports most checkouts could reduce the default number of form elements by 20% to 60%. That's a wide range because it depends how much clutter you started with. Go field by field and ask what you'd do with the answer if it arrived blank. If the honest answer is nothing, the field is friction.
Lead forms follow the same logic. Ask for what you need to qualify the lead and route it correctly: name, one contact method, and a sentence about the job. Then state the response time directly under the button, such as "we reply within one business hour," so the visitor knows what happens next.
A local service business example: a Cincinnati contractor's quote form asked for company size, physical address and annual budget alongside name and phone. Removing the three fields that mattered to nobody produced more completed requests inside a month, with no change in lead quality, because the leads that arrived still had a phone number and a description of the work.
Testing discipline: Change one thing per test, and judge it against completed purchases or submitted leads. Opinions about design are not data.
For WooCommerce specifically, this walkthrough of checkout optimization for online stores shows which settings control field order, guest checkout and cost display.
Pick Your First Test This Month
A monthly rhythm beats a quarterly overhaul. Week one, review the scorecard and choose one hypothesis from your audit. Week two through four, run a single change and leave everything else alone. Then log the result and start again.
Your test log needs six columns: the page, the hypothesis, the one change made, the start and end dates, the result measured against completed leads or sales, and the owner. That log becomes the most useful document your marketing has, because it records what you believed and what happened.
Three rules keep tests honest.
- Never change SEO copy and checkout design in the same week. If two things move and the number moves, you've learned nothing.
- Never judge success from rankings. A page that gains three positions and loses a booking is a loss.
- Always split by mobile and desktop. Averages conceal the failures that matter most for a local business.
A good first test: take your highest-traffic service page with the weakest conversion rate and replace its long contact form with a short one. Compare completed requests over three weeks against the baseline you recorded earlier. One page, one change, one number.
This week, do three things. Write down your 90-day baseline, including leads or revenue per organic session. Choose the single page you'll test first. Put the monthly review date on the calendar and name the person who owns it. If you'd like an outside read on your findings before you start changing pages, Helbling Digital Media is a Cincinnati-based agency and can review your audit with you.
Helbling Digital Media builds the whole chain this guide describes, from technical SEO and Core Web Vitals work to landing pages, lead forms and checkout flows that turn existing traffic into booked appointments and paid orders. If your rankings look fine and your calendar doesn't, HDM can trace where qualified visitors drop off and fix the pages where demand is already arriving. Visit Helbling Digital Media to request a proposal or book a free 30-minute strategy call.